
Download the Complete Report Here
Caesarstone Ltd. (CSTE)
Near-Breakeven EBITDA Validates Structural Cost Reset and Operating Recovery; Litigation Raises Financial Uncertainty
- Key Takeaways:
- Adjusted EBITDA improved to near breakeven at negative $0.1 million, while adjusted gross margin expanded 960 bps y/y to 26.9%, validating the structural cost reset.
- Revenue declined 5.7% y/y to $96.3 million as U.S. weakness persisted, partly offset by Australia’s fifth consecutive quarter of growth.
- Structural savings continue to strengthen profitability, but new U.S. quartz tariffs pose a $10 million to $15 million annualized headwind before mitigation.
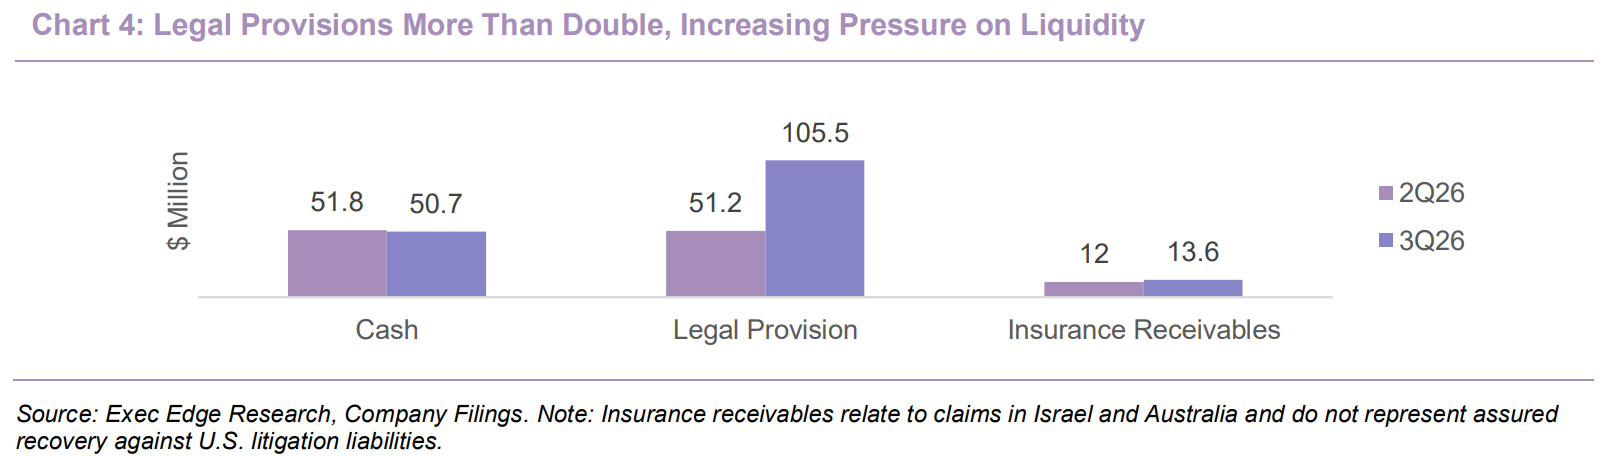
- California’s $46.8 million apportioned verdict and $105.5 million legal provisions exceeding $50.7 million in cash introduce significant financial uncertainty.
- At 0.22x LTM EV/Sales, CSTE trades at a substantial discount to peers, although litigation and financial uncertainty remain key overhangs.
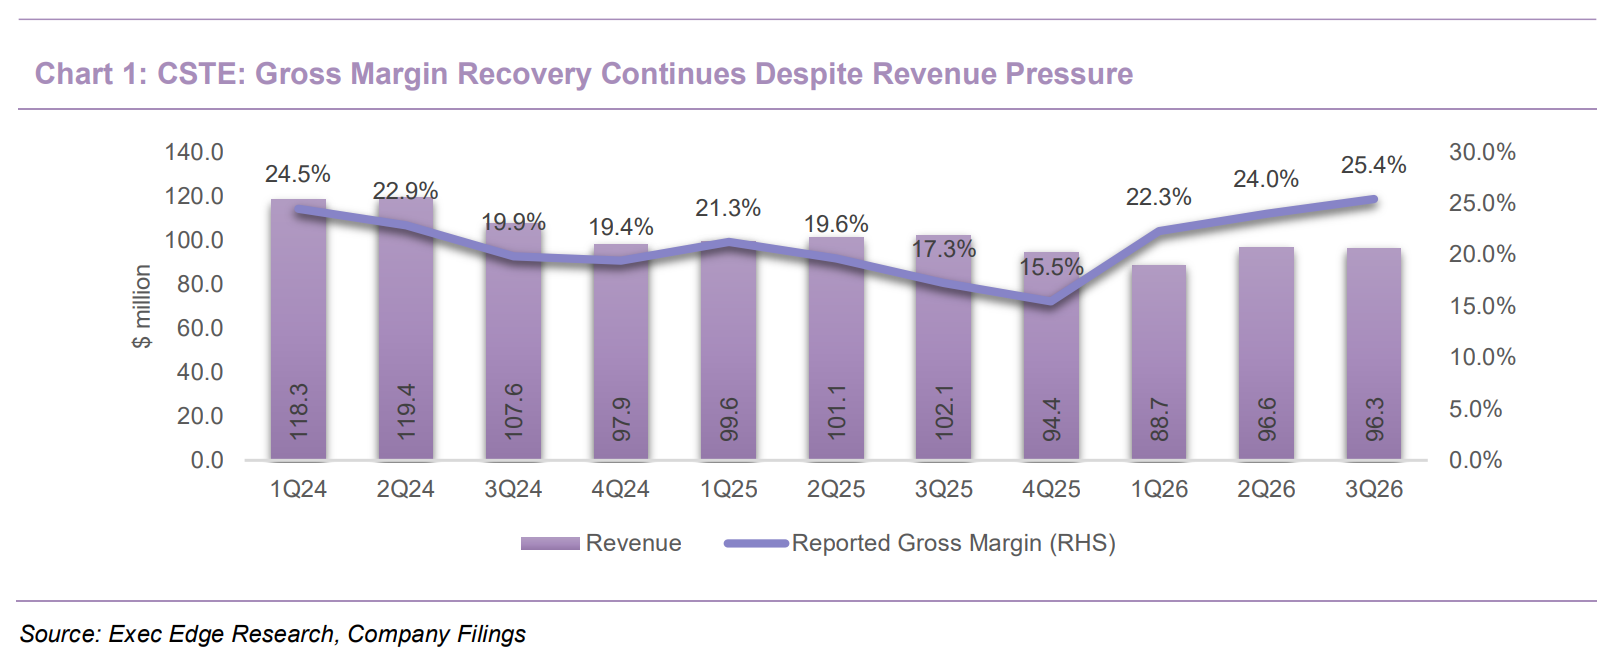
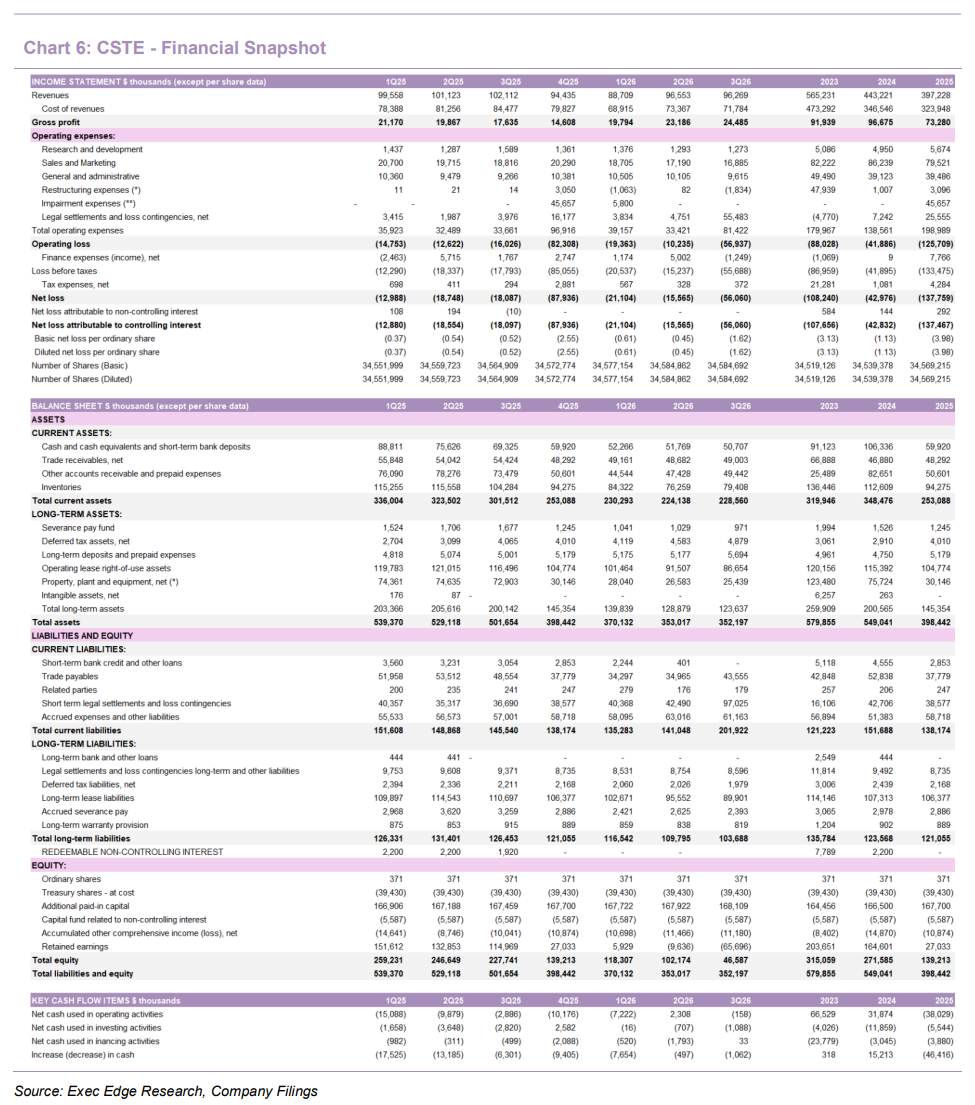
- CSTE’s structural transformation is driving significant margin expansion and improving profitability despite ongoing revenue pressure. CSTE reported 3Q26 revenue of $96.3 million, down 5.7% y/y from $102.1 million and 7.2% on a constant-currency basis, reflecting continued demand softness and competitive pressures, particularly in the U.S. Revenue was largely unchanged sequentially from $96.6 million in 2Q26. Gross margin expanded 810 bps y/y to 25.4%, while adjusted gross margin improved to 26.9% from 17.3%, driven by benefits from the transition to a lower-cost, partner-led production model. Adjusted EBITDA improved to a near-breakeven loss of $0.1 million versus losses of $7.9 million in 3Q25 and $1.0 million in 2Q26, marking a significant milestone in the company’s profitability recovery. The results demonstrate that CSTE’s structural cost reset is translating into meaningful operating leverage despite declining revenue, providing a stronger foundation for sustained profitability as demand stabilizes.
- California litigation verdict materially increases financial uncertainty and alters risk profile. A jury awarded $67.3 million in damages on October 26, 2026, assigning 69.1% of fault to CSTE, or approximately $46.8 million if sustained. Legal provisions increased to $105.5 million from $51.2 million in the prior quarter, more than twice the company’s $50.7 million cash balance and $46.6 million shareholders’ equity. Of these provisions, $97.0 million are classified as short-term liabilities. Silica-related claims rose to roughly 870 globally, including 670 in the U.S. CSTE strongly disputes the verdict and is evaluating available post-trial remedies, while previous verdicts remain under appeal. The company has acknowledged substantial doubt regarding its ability to continue as a going concern, while insurance recoveries remain uncertain and most U.S. claims are not reflected in recorded provisions because losses cannot yet be reasonably estimated. The scale of potential obligations relative to available liquidity and uncertainty around litigation outcomes materially constrain financial flexibility and remain a key valuation overhang.
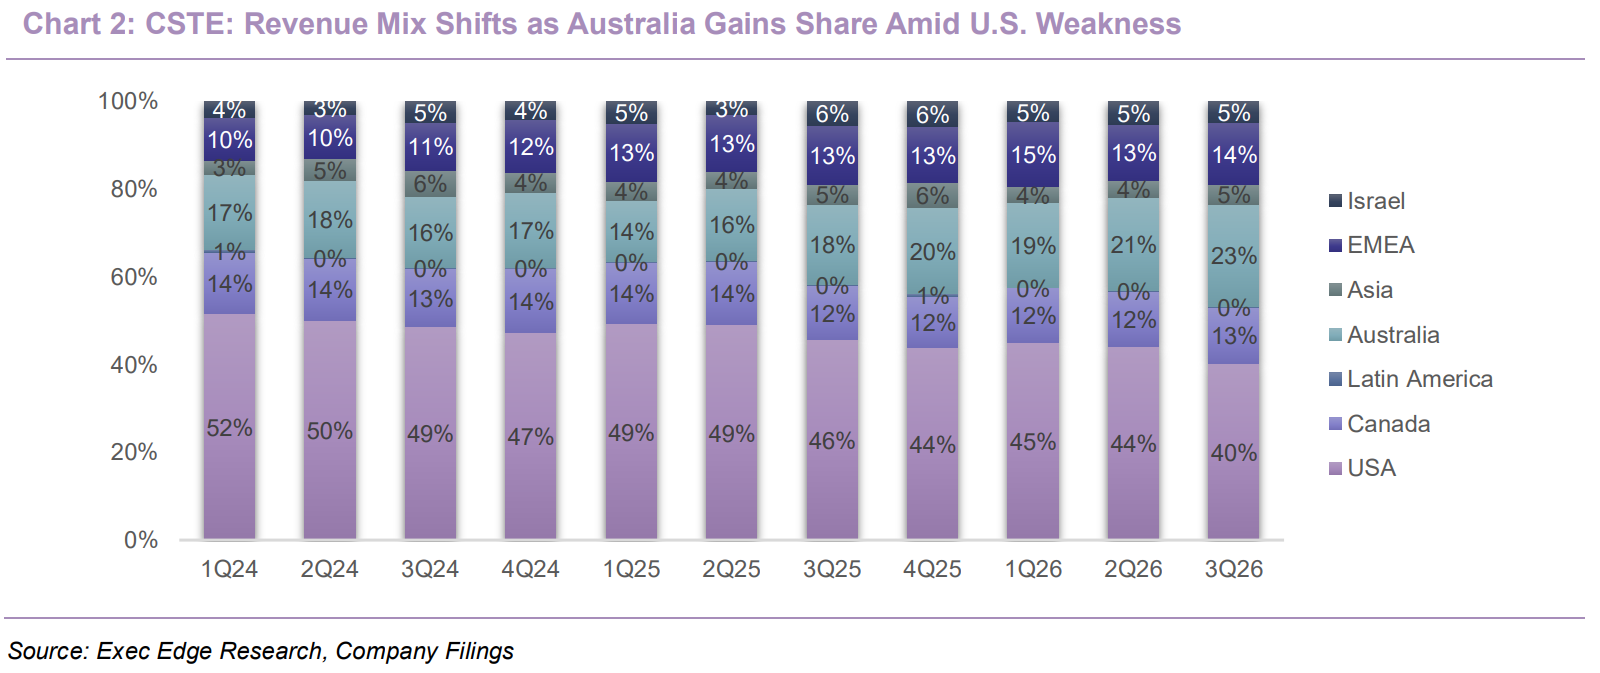
- Big-box growth and Canadian stabilization provide encouraging signs of North American channel resilience despite continued weakness in core markets. Big-box revenue increased y/y in 3Q26, led by IKEA, extending the positive trend from 2Q26 when the channel grew approximately 3%. Canada also showed meaningful improvement, with revenue declining just 0.7% in constant currency compared with a 17.5% contraction in 2Q26, supported by IKEA growth. These developments suggest improving execution across established retail relationships, although broader recovery has yet to materialize. U.S. revenue declined 16.9% y/y to $38.8 million, down approximately 9.1% sequentially, reflecting continued softness in core quartz volumes across commercial projects, residential developments, and stone-supplier channels. With the U.S. accounting for approximately 40% of consolidated revenue, CSTE remains focused on strengthening fabricator relationships, improving channel productivity, and rebuilding customer engagement to translate early retail momentum into broader volume stabilization.
- Australia’s sustained ICON-led growth reinforces the multi-material strategy, while other markets show mixed signs of stabilization. Australian revenue increased 21% y/y to $22.4 million, or 12.2% in constant currency, marking the fifth consecutive quarter of growth following the full rollout of the crystalline-silica-free ICON collection in 2Q25. The performance reflects sustained customer adoption and the success of CSTE’s product substitution strategy despite weak underlying surface demand, with Australia now contributing approximately 23% of consolidated revenue versus 18% a year ago. Elsewhere, EMEA remained broadly stable at $13.4 million, with constant-currency growth of 0.8%, while other Asian markets declined 7.6% to $4.4 million and Israel fell 16.7% to $4.8 million. Australia’s momentum provides the clearest evidence of CSTE’s ability to leverage product innovation and existing distribution relationships to drive a sustained regional recovery.
- Multi-material expansion and targeted commercial investment remain central to restoring growth beyond restructuring benefits. CSTE continues to broaden its porcelain offering through Lioli and external production partners, leveraging its established distribution network to expand beyond quartz countertops into flooring, cladding, and other architectural applications. The strategy is further supported by continued investment in designer engagement, product specification, and technical education to drive adoption of new materials. An October product announcement highlighted an independently verified Environmental Product Declaration covering 24 ICON designs, strengthening the collection’s positioning in sustainability-focused architectural projects. Sales and marketing expenses declined to $16.9 million in 3Q26 from $18.8 million a year earlier, reflecting cost discipline alongside continued commercial investment. While Australia’s ICON-led recovery demonstrates successful product adoption, porcelain remains an emerging growth opportunity, with its revenue contribution, Lioli utilization, and margin potential yet to be quantified.
- Structural cost savings continue to drive significant gross-margin expansion despite declining revenue. Gross margin expanded 810 bps y/y and 140 bps sequentially to 25.4% in 3Q26, while adjusted gross margin reached 26.9% versus 17.3% in 3Q25 and 26.5% in 2Q26. Cost of revenues declined 15% y/y to $71.8 million, significantly outpacing the 5.7% revenue contraction, reflecting lower production costs following the closure of Bar-Lev in December 2025 and the transition to global production partners. Margins benefited from $0.9 million in refunds related to previously paid U.S. tariffs, compared with $2.0 million in 2Q26. Excluding this benefit, adjusted gross margin remained approximately 26%, reinforcing the underlying improvement in production economics. The Bar-Lev closure is expected to generate $22 million in annualized cash savings once fully implemented, contributing to the broader restructuring target of more than $100 million in annualized savings by 2027 relative to 2023. With most remaining Bar-Lev inventory expected to be sold by year-end 2026, the transition should further reduce legacy manufacturing costs and support margin sustainability.
- New U.S. quartz tariffs pose a significant risk to margin recovery, increasing the importance of pricing and sourcing flexibility. The four-year U.S. quartz tariff-rate quota, effective August 15, 2026, imposes additional tariffs of 25% on covered imports within the first-year industry quota of ~13 million square meters and 50% above the quota, on top of existing import duties averaging 15% for CSTE’s U.S. imports. The company estimates an incremental annualized cost impact of $10 to $15 million, equivalent to approximately $2.5 million to $3.75 million per quarter before mitigation, and implemented U.S. price increases in September while evaluating further sourcing and supply-chain adjustments. However, recovering higher landed costs remains challenging given the 16.9% y/y decline in U.S. revenue and persistent competition in core quartz channels. With 3Q26 reflecting only partial tariff exposure, 4Q26 will provide the first full-quarter test of pricing realization and mitigation efforts. The partner-led production model provides sourcing flexibility, but the incremental tariff burden is material relative to 3Q26’s near-breakeven adjusted EBITDA, making the effectiveness of pricing and sourcing actions critical to sustaining profitability improvements.
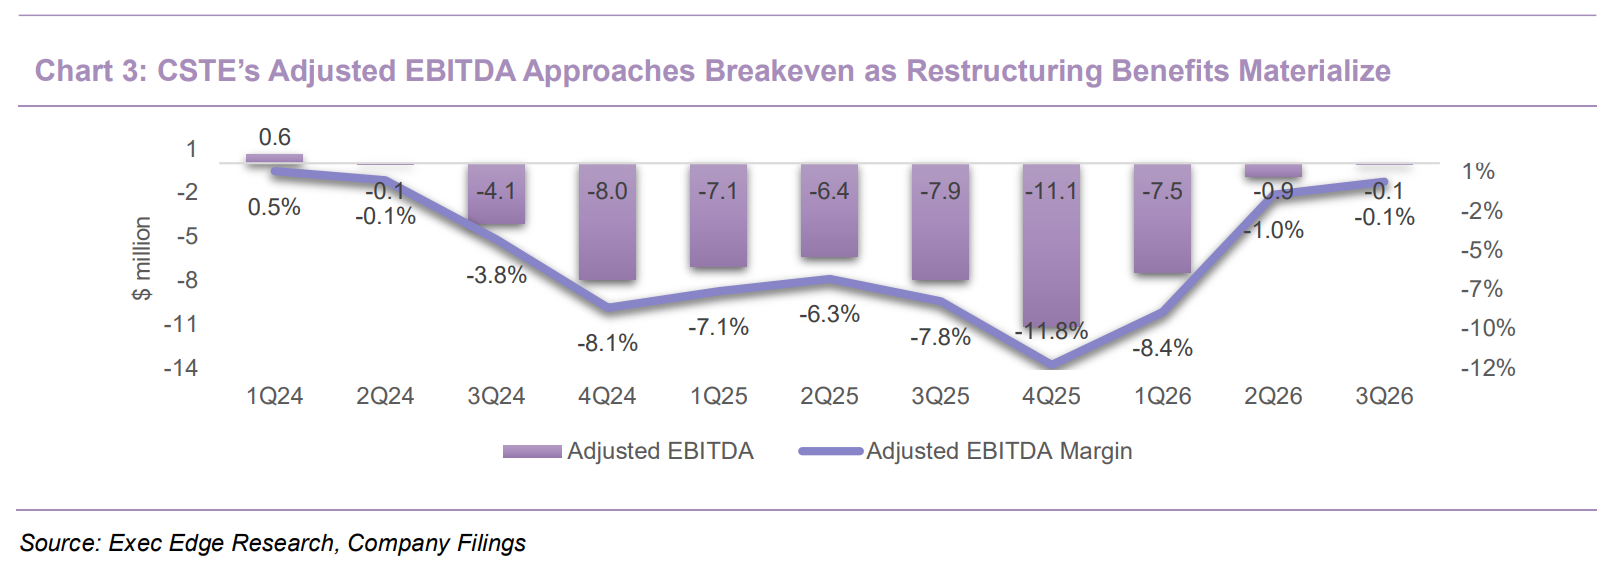
- Adjusted EBITDA approaches breakeven as restructuring benefits translate into stronger operating profitability. Adjusted EBITDA improved to a loss of $0.1 million in 3Q26 from losses of $7.9 million in 3Q25 and approximately $1.0 million in 2Q26. For 9M26, adjusted EBITDA losses narrowed to $8.6 million from $21.4 million, representing a $12.8 million improvement despite revenue declining 7.0% to $281.5 million. Underlying operating expenses, excluding legal settlements, impairments, and restructuring charges, declined to approximately $27.8 million from $29.7 million, or 28.8% of revenue from 29.1% a year earlier, supported by disciplined spending, with R&D declining to $1.3 million from $1.6 million and G&A remaining broadly stable at $9.6 million. The underlying earnings improvement contrasts sharply with the reported net loss of $56.1 million, or $1.62 per share, versus $18.1 million, or $0.52 per share, in 3Q25, primarily reflecting $55.5 million in legal settlements and loss contingencies. Excluding specified adjustments, net loss narrowed to $1.6 million from $13.8 million, with adjusted loss per share improving to a loss of $0.05 from a loss of $0.40. The improvement in adjusted earnings alongside declining revenue demonstrates stronger cost absorption and a structurally lower operating breakeven point, reinforcing progress toward sustainable profitability.
- Working capital discipline and lower capital requirements are driving improved cash flow. Net cash used in operating activities narrowed to $5.1 million in 9M26 from $27.9 million in 9M25, supported by improved profitability and inventory reductions. Inventory declined to $79.4 million from $94.3 million at year-end 2025, generating approximately $14.6 million in operating cash-flow benefit, despite a sequential increase from $76.3 million in 2Q26. Trade receivables remained stable at $49.0 million versus $48.3 million at year-end, while payables increased to $43.6 million from $37.8 million. Capital expenditures fell to $1.4 million from $8.2 million, reflecting the lower capital intensity of outsourced production, with free cash outflow narrowing to $6.5 million from $36.1 million. Importantly, the 9M26 cash-flow reconciliation included $64.1 million in litigation-related provisions, indicating that significant recorded legal expenses have yet to translate into equivalent cash outflows.
- Liquidity preservation has become a critical priority given elevated legal exposure. CSTE ended 3Q26 with $50.7 million in cash, cash equivalents, and short-term deposits, broadly stable compared with $51.8 million in 2Q26, while insurance receivables increased modestly to $13.6 million from $12.0 million. Total legal provisions stood at $105.5 million, including $97.0 million classified as short term, exceeding available cash by approximately $54.8 million. Importantly, the insurance receivables relate to claims in Israel and Australia and do not provide assured coverage for U.S. litigation liabilities. With many U.S. claims not reflected in current provisions, potential obligations could be materially higher, while uncertain settlement amounts and payment timing further constrain financial flexibility.
- Balance-sheet flexibility has narrowed significantly despite lower capital requirements and the absence of bank debt. Shareholders’ equity declined to $46.6 million from $139.2 million at year-end 2025, while current assets fell to $228.6 million from $253.1 million and current liabilities increased to $201.9 million from $138.2 million, reducing the current ratio to 1.13x from 1.83x. The deterioration largely reflects higher litigation-related provisions, which have significantly increased current liabilities and reduced shareholders’ equity. Long-term lease liabilities of $89.9 million represent an additional contractual obligation, although potential subleasing of the closed Bar-Lev facility could provide incremental relief. While lower capex and the absence of financial-institution debt provide some flexibility, potential litigation-related cash requirements materially constrain discretionary capital deployment. Preserving liquidity, completing restructuring activities, and maintaining selective commercial investment remain key priorities, with financial flexibility increasingly dependent on legal outcomes and settlement timing.
- The near-term outlook hinges on sustaining operating profitability as tariff pressures intensify and demand recovery remains uneven. Following the improvement from a $7.9 million adjusted EBITDA loss in 3Q25 to near breakeven in 3Q26, 4Q26 will test the durability of restructuring benefits as the new U.S. tariffs apply for a full quarter and September pricing actions begin to flow through results. U.S. demand stabilization remains essential, while Australia’s fifth consecutive quarter of growth and improving Canadian performance provide encouraging offsets. Beyond the near term, the $100 million-plus annualized restructuring savings target by 2027, broader ICON adoption, and porcelain commercialization remain important drivers of potential margin and revenue recovery. The critical indicators will be CSTE’s ability to sustain positive adjusted EBITDA, recover incremental tariff costs through pricing and sourcing actions, stabilize North American volumes, and generate positive operating cash flow. However, ongoing litigation uncertainty remains a significant risk to financial flexibility and the broader recovery outlook.
Valuation Discount Offers Re-Rating Potential, Subject to Litigation & Financial Uncertainty
- Disclaimer: Exec Edge does not publish proprietary estimates, ratings, price targets, or investment recommendations. The valuation discussion below is illustrative only and is based on company filings, management commentary, and third-party data and estimates. It does not constitute a recommendation, price target, rating, or prediction of future pricing.
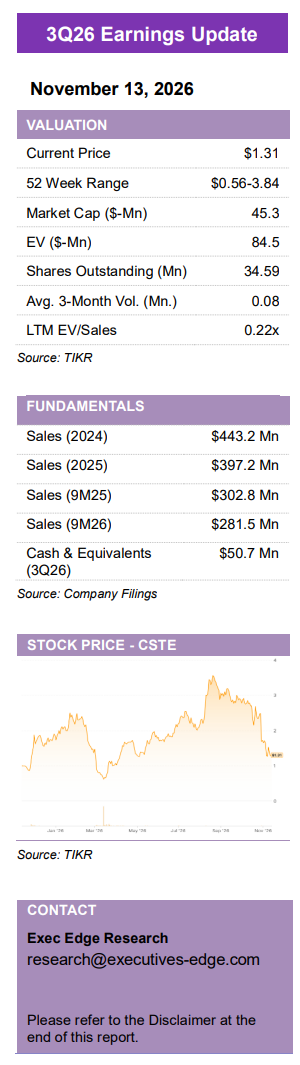
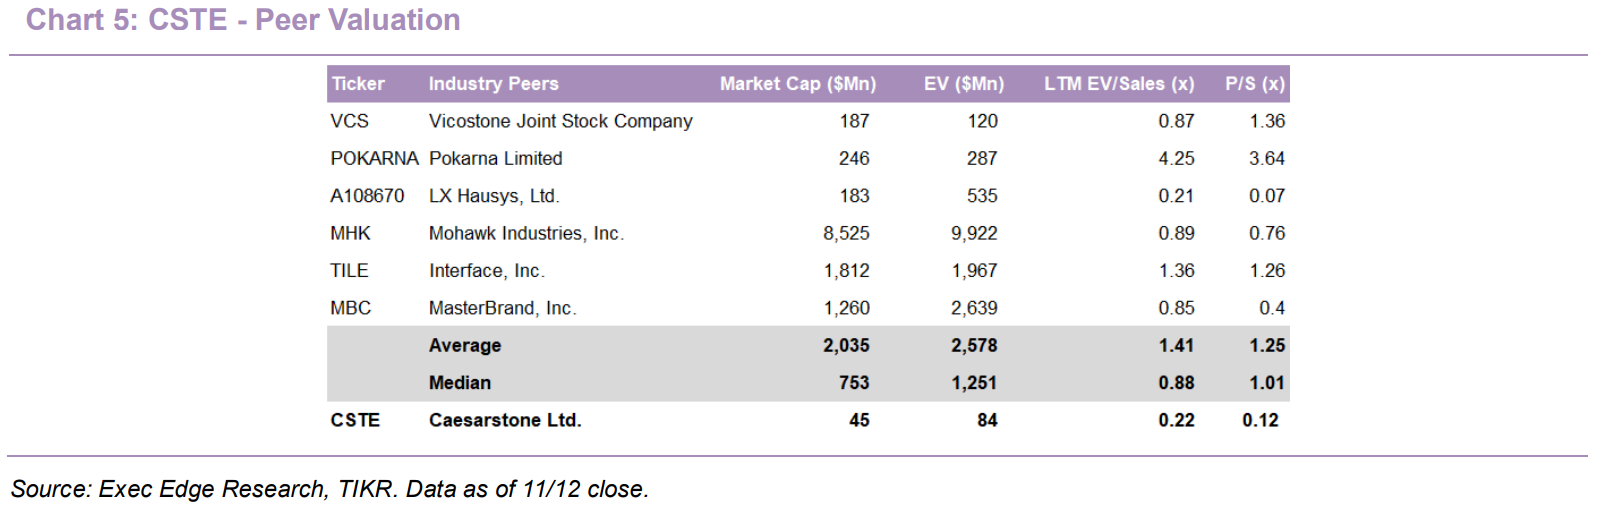
- CSTE trades at a substantial discount to peers, reflecting heightened legal and liquidity uncertainty. At $1.31 per share, CSTE has a market capitalization of approximately $45 million and enterprise value of $84.5 million, representing 0.22x LTM EV/Sales and 0.12x P/Sales. The stock trades at a 75% discount to the peer median of 0.88x EV/Sales, despite improving margins and near-breakeven adjusted EBITDA. While differences in scale and profitability warrant a discount, the significant valuation gap also reflects heightened uncertainty surrounding litigation liabilities and their potential impact on financial stability and shareholder value.
- Operating recovery supports valuation potential, although litigation and financial uncertainties warrant a risk discount. Applying an illustrative 0.45x EV/Sales multiple, representing a 49% discount to the 0.88x peer median to account for heightened legal and financial risks, to LTM revenue of approximately $375.9 million implies an enterprise value of $169 million versus the current $84.5 million. This translates into an illustrative equity value of approximately $130 million, or $3.76 per share. The conservative multiple recognizes both CSTE’s operating recovery and the substantial risk discount warranted by current financial uncertainties. Importantly, the implied equity value is before potential litigation-related cash outflows, which could exceed recorded provisions, and does not account for potential financing requirements or shareholder dilution. The multiple discount should therefore not be viewed as fully capturing the ultimate financial impact of litigation. Greater clarity on litigation liabilities and improved financial visibility could support a higher valuation multiple over time, although the timing and extent of any potential re-rating remain uncertain.
- Sustained profitability, North American stabilization, tariff mitigation, and litigation resolution are key catalysts. Adjusted gross margin reached 26.9% in 3Q26, with adjusted EBITDA approaching breakeven, while Australia’s 12.2% constant-currency growth reinforces the multi-material strategy. The $100 million-plus annualized savings target by 2027, stabilization of U.S. demand, and mitigation of the $10 million to $15 million tariff burden could support further profitability improvements. Greater clarity on litigation liabilities and reduced going-concern uncertainty would be equally critical to restoring investor confidence and unlocking further multiple expansion.
Read Exec Edge’s Initiation on Caesarstone Ltd. Here
Subscribe to our Weekly Newsletter to Receive All Research
Contact: