Download the Complete Report Here
 Lands’ End, Inc. (LE)
WHP JV Sets the Stage for Debt-Light Growth and Value Creation
- The WHP JV transforms Lands’ End into a debt-light licensed operator with retained exposure to global brand monetization. LE is a leading digital apparel and uniform retailer spanning DTC, Outfitters, marketplaces and stores. In April 2026, it transferred the Lands’ End IP and existing licenses to a 50/50 JV with WHP Global, received $300 million in cash and used $234 million to repay its term loan. LE continues operating DTC and Outfitters under a long-term license, pays guaranteed minimum royalties and receives 50% of JV profits. The structure provides a capital-light route into new categories and markets through WHP’s partner network, without requiring LE to fund the full cost of expansion.
- LE’s defensible business model combines recognizable product franchises, enduring customer relationships, embedded institutional programs and a scalable licensing platform. Franchises such as Squall, Wanderweight, Tugless Tank and personalized totes address recurring functional needs, while an average customer relationship of approximately 20 years supports proprietary first-party insight. Outfitters adds multi-year relationships across businesses and more than 5,000 schools, reinforced by scaled embroidery, personalization and fulfillment infrastructure.
- Growth strategy, led by new CEO Charlie Cole, combines capital-light licensing expansion with focused execution across products, customers and digital infrastructure. The JV has consolidated and extended three apparel licenses, advanced footwear and home-textile partnerships and developed more than 12 category and international opportunities. Within retained operations, LE is concentrating investment behind scalable franchises, AI-enabled engagement and Manhattan and SAP systems to strengthen fulfillment, personalization and operating scalability. Cole’s digital-commerce, AI and transformation experience is well aligned with this execution phase.
- LE’s channel and product mix provide exposure to faster-growing digital and uniform markets within apparel. More than 95% of its business is conducted online, while Outfitters represented 18.1% of FY25 revenue. Functional products, dependable fit, visible value and technology-enabled convenience align the brand with evolving customer preferences, while recurring uniform demand and capital-light licensing participation broaden the growth opportunity beyond traditional apparel retail.
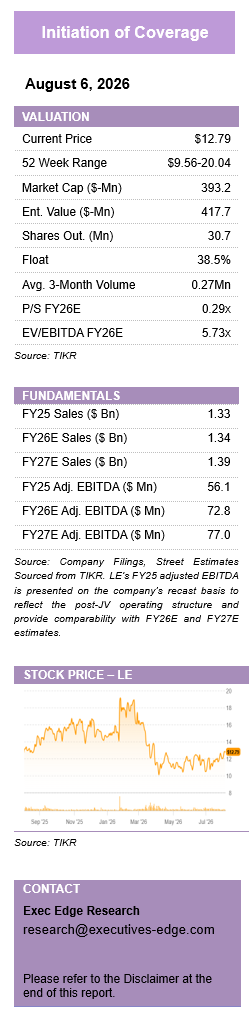
- Balance-sheet reset creates a clearer path to earnings growth and potential valuation upside. Management guided FY26 revenue to $1.30-$1.40 billion and adjusted EBITDA to $68-$78 million, implying recovery from the recast FY25 EBITDA base and progressive margin expansion. Term-loan repayment reduced conventional net debt to ~$6.9 million, while fulfillment normalization, merchandise-margin improvement, lower interest expense and rising JV profits should support cash conversion. While we do not have a price target or rating on LE, we note that it trades at 5.7x FY26E adjusted EBITDA versus an 8.9x peer average, suggesting re-rating potential as the post-JV model supports a more profitable, less leveraged and increasingly capital-light earnings profile.
Company and JV Overview
WHP JV Reshapes LE’s Operating Model and Expands Brand-Monetization Potential
- Lands’ End combines a scaled digital consumer business with a differentiated uniform platform. Lands’ End, Inc. (NASDAQ: LE) is a leading digital retailer of solution-based apparel, swimwear, outerwear, accessories, footwear, home products and uniforms, serving consumers through owned eCommerce websites, third-party marketplaces and company-operated stores, as well as businesses and more than 5,000 U.S. schools through Lands’ End Outfitters. Founded in 1963, LE evolved from a catalog retailer into a predominantly digital business, with more than 95% of its activity conducted online and net revenue of $1.34 billion in FY25, the 52 weeks ended January 30, 2026. Under its traditional model, LE owned the Lands’ End intellectual property, designed and sourced merchandise, marketed and sold products through direct-to-consumer (DTC) and business-to-business (B2B) channels, and licensed the brand to third parties in exchange for royalties.
- The WHP transaction adds capital-light licensing participation while materially reshaping LE’s operating model. In April 2026, LE formed a 50/50 JV with WHP Global, a global brand-management and licensing platform, separating ownership and licensing of the Lands’ End brand from LE’s retained DTC and Outfitters operations. The Lands’ End trademarks, related intellectual property and existing license agreements were transferred into a 50/50 JV controlled by WHP Global, while LE retained responsibility for product design, sourcing, merchandising, marketing and commercial execution across its principal operating channels. LE now conducts those activities under a long-term license from the JV and pays royalties for the right to design, manufacture, promote and sell specified products across agreed channels and territories. Trademark royalties from transferred and newly originated third-party licenses accrue to the JV rather than LE, while LE receives 50% of JV profits, net of expenses, and continues to earn fulfillment fees for services provided to certain licensees. The resulting structure combines LE’s operating and cash-generating capabilities with WHP’s global licensing platform, while introducing a royalty-bearing cost structure and giving WHP control over the jointly owned brand-management entity.
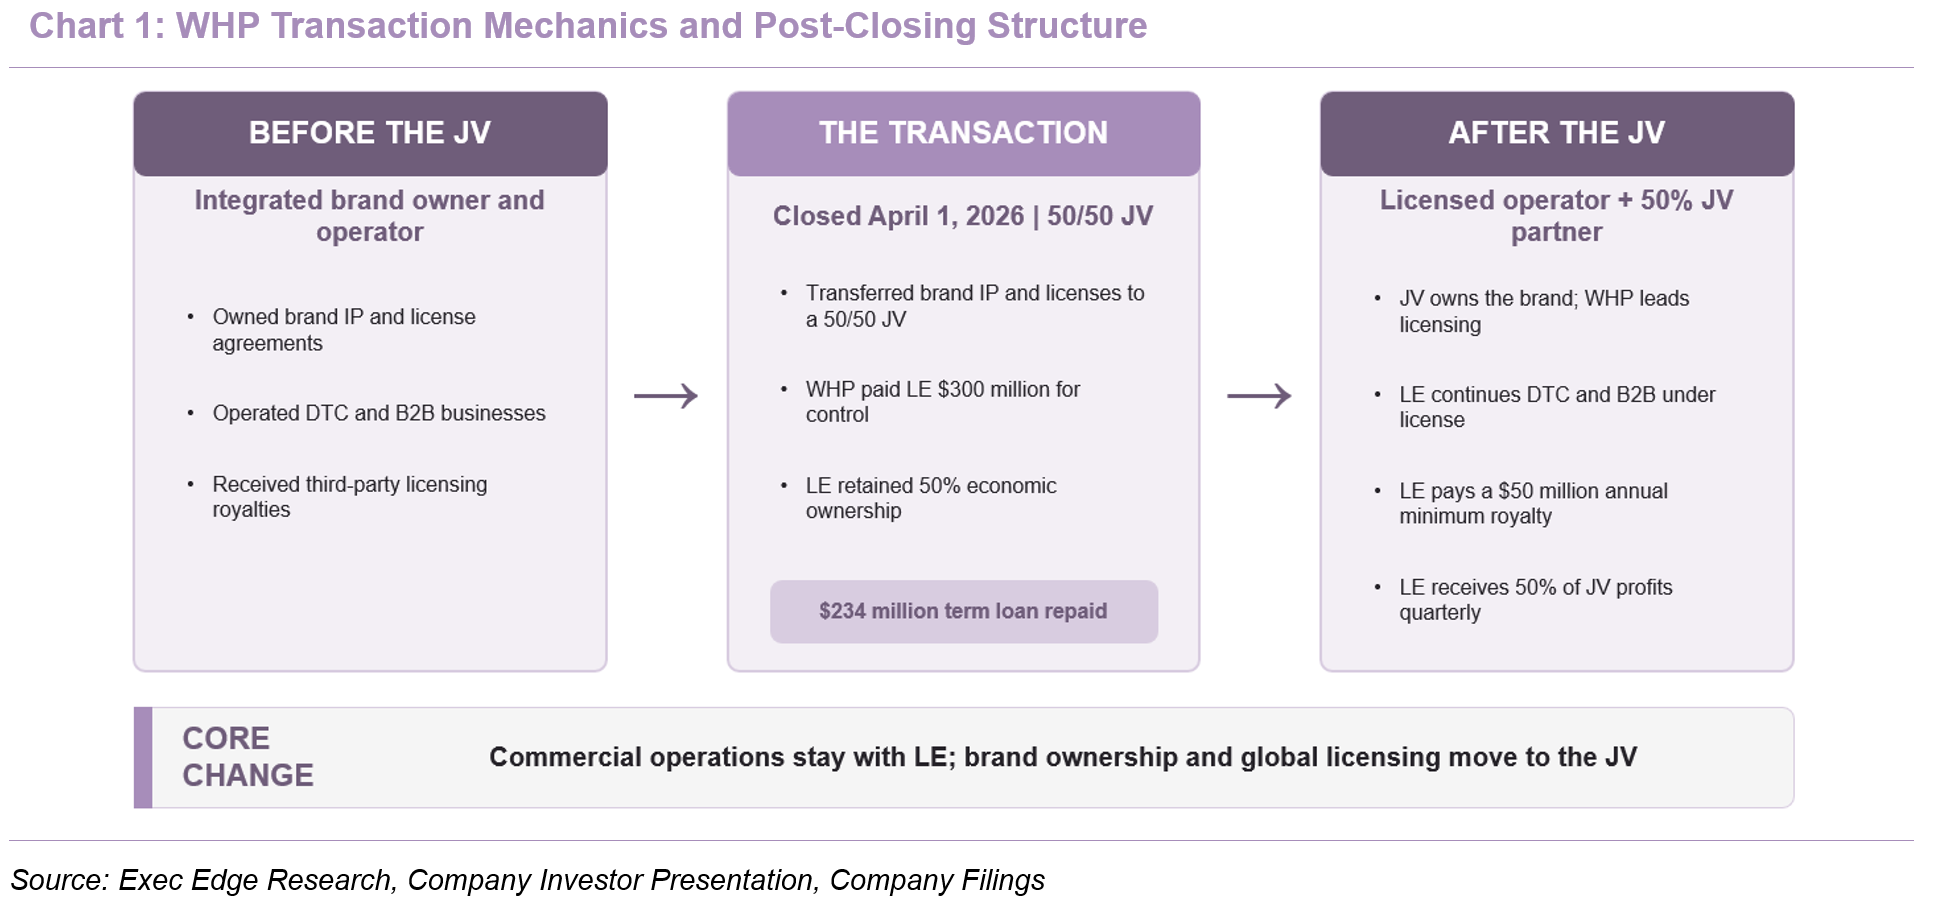
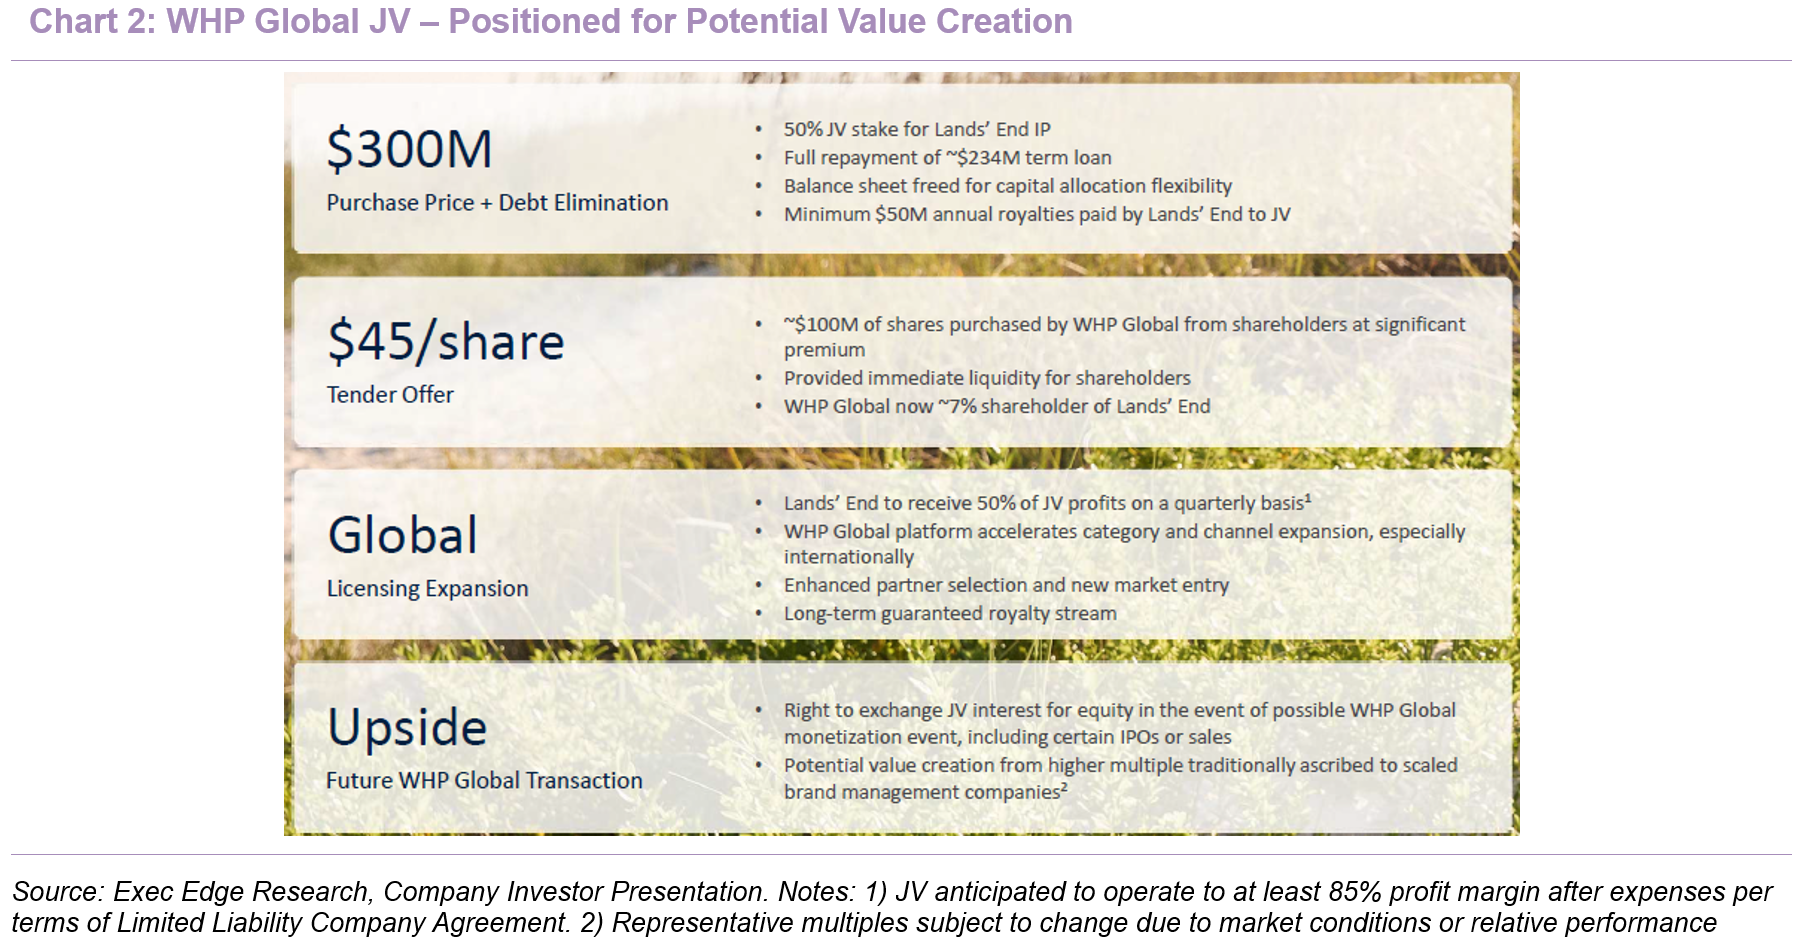
- WHP acquired control of the brand-management platform while LE retained equal economic ownership. The April 2026 WHP JV transferred brand ownership into a jointly owned platform while preserving LE’s commercial operations. At closing, LE contributed all intellectual property and related assets associated with the Lands’ End brand, including existing license agreements, to newly formed LE Topco, LLC, before selling WHP Global a 50% controlling ownership interest for $300 million in cash and contributing $1.25 million of initial cash to the JV. LE retained the remaining 50% economic interest, which is accounted for under the equity method because WHP Global controls the entity; the governing board consists of four managers, two appointed by each party, but WHP Global’s appointees collectively hold an additional vote. A separate tender offer purchased $100 million of LE shares from stockholders at $45.00 per share, leaving WHP Global with approximately 7.2% of outstanding common stock without providing any tender-offer proceeds to LE. Of the cash received by LE, $234 million was used to repay the outstanding term-loan principal, together with $0.9 million of accrued interest, terminating the facility and releasing its guarantees, liens, leverage covenant and minimum-liquidity requirement. Working-capital funding remains available through a $225 million revolving ABL facility, which had $30 million outstanding and $104.2 million of available capacity as of May 1, 2026.
- The JV structure materially reduces financial leverage while preserving participation in licensing growth, although the new royalty obligation resets LE’s cost base. Under the operating license, LE pays the JV royalties based on channel-specific rates, subject to a GMR of $50 million annually through contract year 11, calculated pro rata during the first year; the minimum then increases 1% annually during contract years 12 through 21 before settling at $55.2 million for each subsequent year. This royalty expense became part of the post-transaction operating model, and in 1Q FY26 (the 13 weeks ended May 1, 2026) the new JV royalty structure was identified alongside distribution-center disruption and tariff costs as a contributor to the 410 bps decline in gross margin to 46.7% and the 660 bps decline in U.S. Digital variable-profit margin to 16.6%. In parallel, full repayment eliminated the term loan but LE retained $30.0 million of ABL borrowings at May 1, 2026. The retained JV interest provides LE with 50% of JV profits through quarterly distributions, including royalties generated by LE’s operations, transferred licenses and new agreements developed by WHP Global. Certain qualifying WHP Global listings or sales may also allow or require LE to exchange its JV interest for WHP Global equity at the valuation multiple applied in that transaction. Early post-closing activity indicates that WHP has begun converting the licensing strategy into executed agreements and an active expansion pipeline.
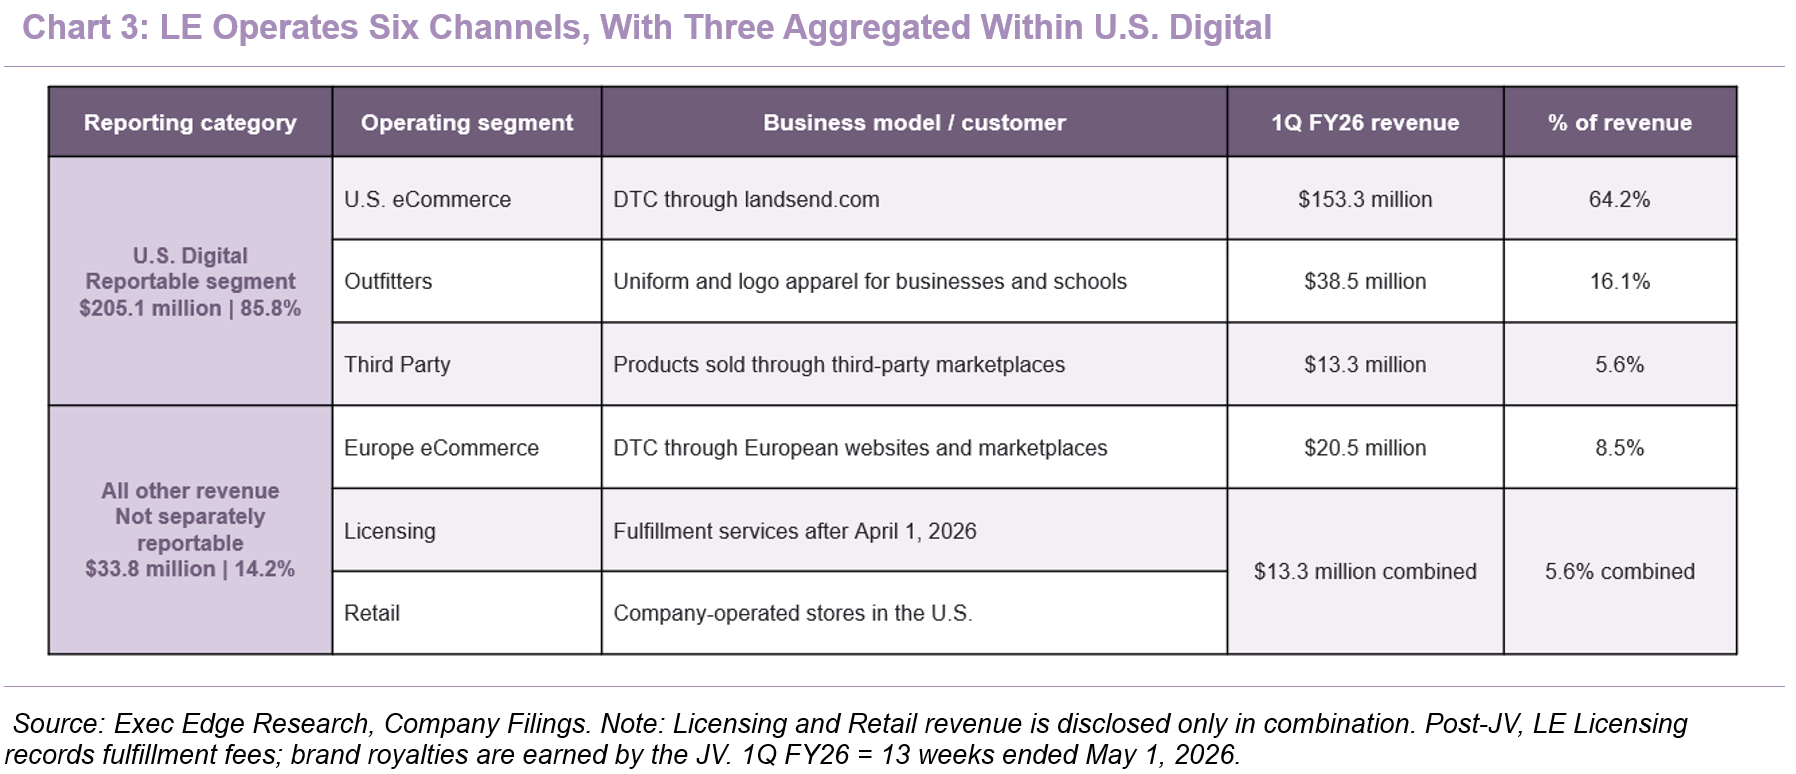
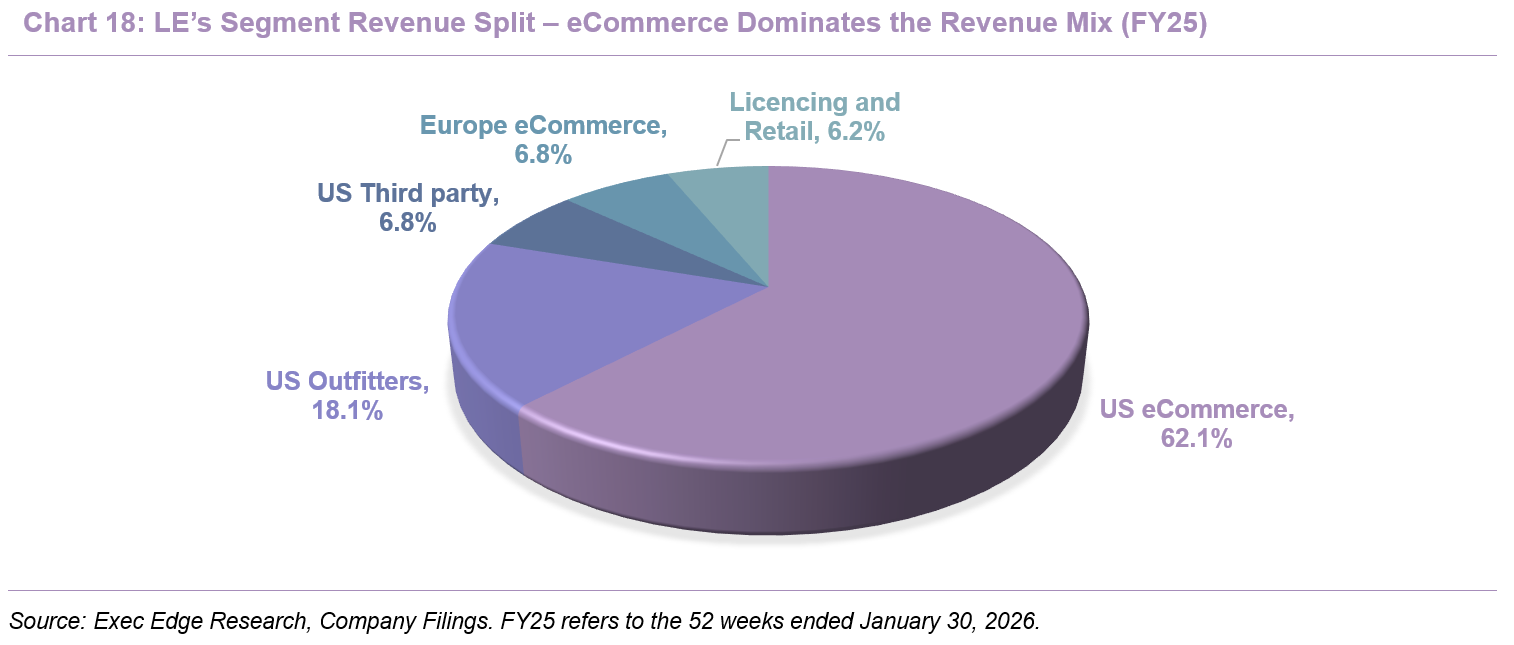
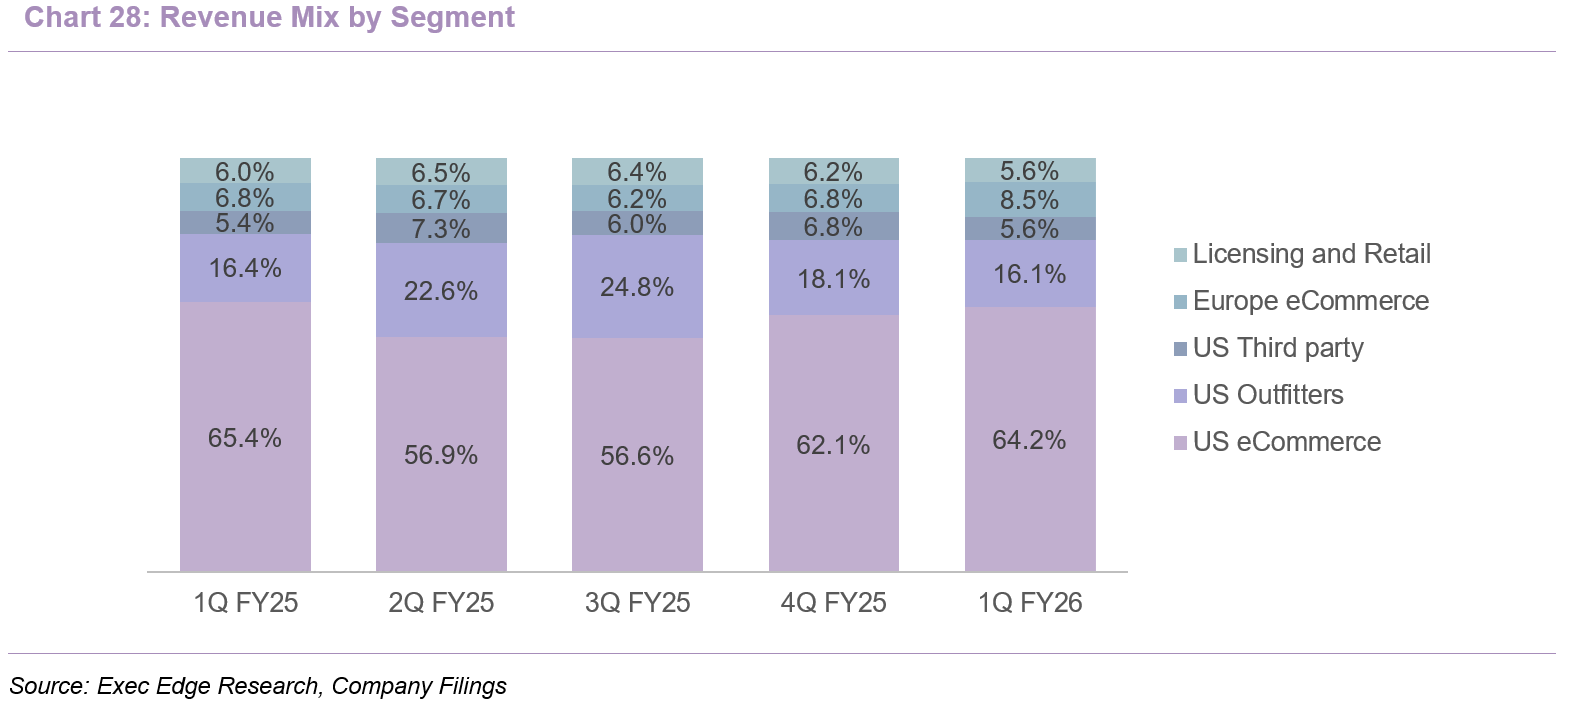
- LE retains six operating channels, with its core consumer, Outfitters and marketplace businesses reported within U.S. Digital. U.S. eCommerce continues to sell through landsend.com, Europe eCommerce serves consumers through localized websites and third-party marketplaces, and Outfitters supplies uniform and logo apparel to businesses, employees, schools and student households, primarily in the U.S. The Third Party channel distributes merchandise through external marketplace websites, Retail comprises company-operated U.S. stores, and Licensing now records fulfillment fees for services provided to third parties rather than royalties from the transferred trademark agreements. For external reporting, U.S. eCommerce, Outfitters and Third Party are aggregated within the U.S. Digital segment because they share similar economic and qualitative characteristics, while Europe eCommerce, Licensing and Retail remain separate operating segments that do not individually meet reportable-segment thresholds. In 1Q FY26, U.S. eCommerce generated 64.2% of net revenue, Outfitters 16.1%, Third Party 5.6%, Europe eCommerce 8.5%, and Licensing and Retail together 5.6%, producing consolidated net revenue of $238.9 million.
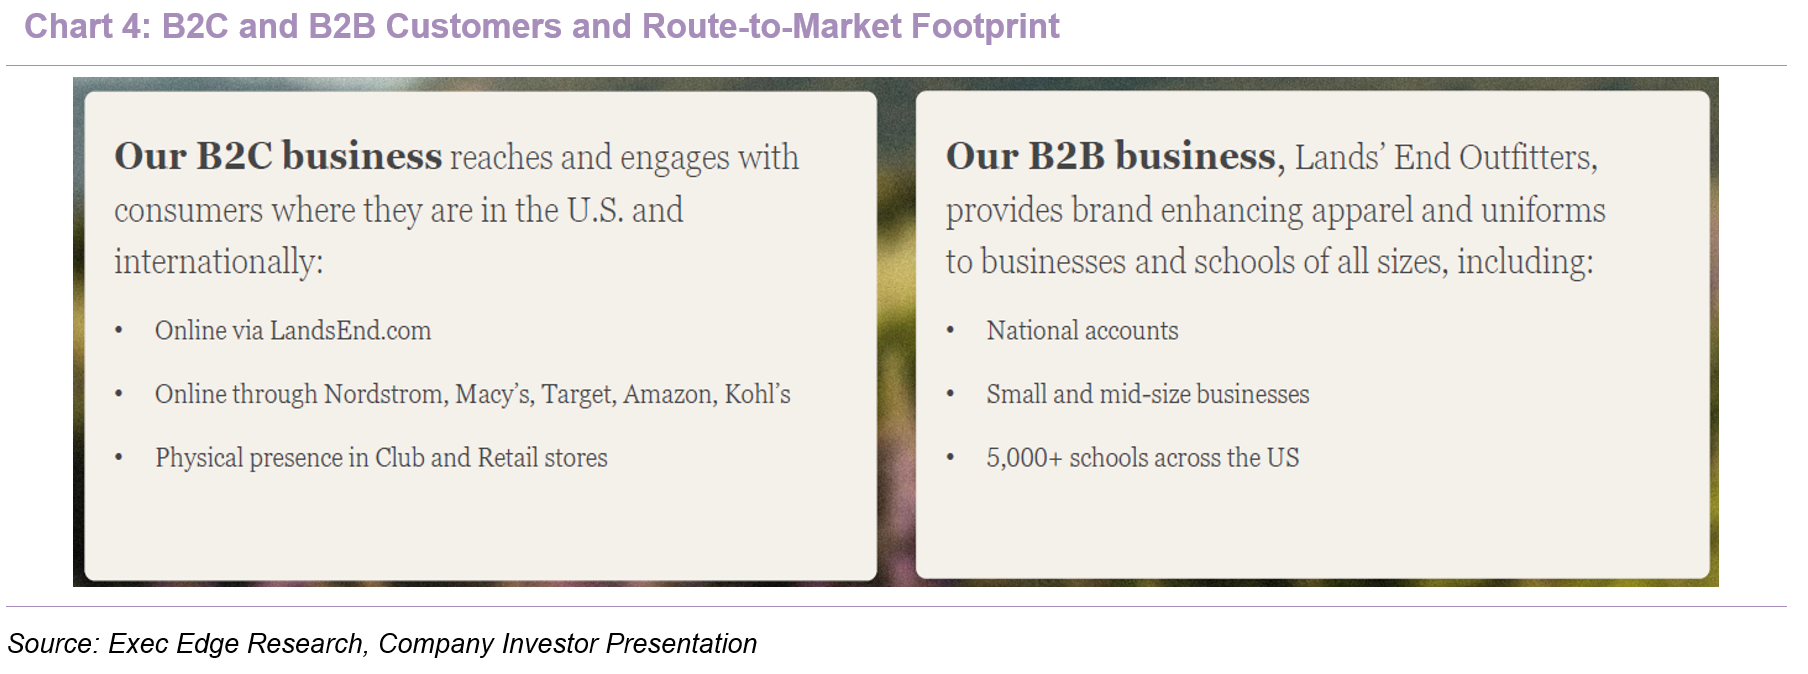
- LE combines broad consumer category exposure with a differentiated B2B uniform platform and multi-channel distribution footprint. Across these channels, LE serves individual consumers, businesses and schools through a broad solutions-oriented merchandise portfolio. Consumer categories include women’s and men’s apparel, swimwear, outerwear, bottoms, accessories, footwear and home products, with established product identities such as Squall, Wanderweight, Anyweather, Tugless Tank, Beach Living, Starfish, Iron Knees and ThermaCheck. Development and merchandising are organized around fit, fabric performance, quality construction and practical use cases, with product teams coordinating assortment breadth, inventory commitments, promotions, clearance and seasonal refreshes alongside sourcing and marketing. Outfitters extends the same operating platform into business uniforms, logo apparel and schoolwear, serving national accounts, small and mid-sized businesses, and more than 5,000 U.S. schools through customized products and digital ordering environments. Consumer distribution extends beyond owned websites to marketplaces and retailers including Amazon, Nordstrom, Macy’s, Target and Kohl’s, while customer support is available through digital self-service and agents using phone, chat, email, text and social media. Fit testing, quality assurance and product compliance are embedded within product development, while LE also provides fulfillment and selected marketing services for certain third-party licensed products sold through its website. Although the associated trademarks are now held by the JV, product selection, assortment management and customer-facing execution remain within LE’s licensed operating responsibilities.
- LE supports its digital and Outfitters businesses through an owned U.S. distribution network and a diversified global sourcing base. Supporting this customer base is a Wisconsin-centered logistics network connected to international offices and globally distributed suppliers. The approximately 200-acre Dodgeville campus contains approximately 1.8 million square feet of owned space for headquarters, customer service and distribution functions, including a roughly 1.3 million-square-foot distribution center, while additional owned facilities provide 550,000 square feet in Reedsburg and 150,000 square feet in Stevens Point. European operations are supported by a 185,000-square-foot distribution and customer-service center in Oakham, U.K., together with offices in Mettlach, Germany; the wider network also includes a sourcing office in Hong Kong and leased offices in New York and Chicago. As of January 30, 2026, the retail footprint comprised 21 leased U.S. stores averaging approximately 7,900 square feet, and International sales represented ~8% of FY25 net revenue, with orders fulfilled to customers in ~130 countries outside the U.S. Independent manufacturers produce LE merchandise in approximately 20 countries, primarily through Asian supply chains, with the five largest sourcing countries accounting for approximately 71% of purchases and the top 10 vendors accounting for approximately 63%; approximately 40 vendors manufactured substantially all products. LE employed approximately 3,900 people, including approximately 3,600 in the U.S., and added approximately 1,500 flexible part-time workers during school-uniform and holiday peaks, while vendor requirements covered labor practices, workplace safety and applicable legal standards.
Growth Strategy
Multiple Strategic Priorities Broaden Reach and Strengthen Earnings Potential
- LE’s growth strategy combines capital-light licensing expansion with focused investment in product franchises, customer relationships and operating capabilities. Management intends to use the WHP Global JV to enter new categories and international markets, while concentrating the retained DTC and Outfitters businesses around solution-led franchises, younger customer acquisition, personalization and improved digital execution. Together, these initiatives are designed to broaden the brand’s reach, support higher-quality revenue growth, expand recurring JV profit participation and strengthen the commercial platform supporting LE’s post-JV operating model. We discuss each of these focus areas below.
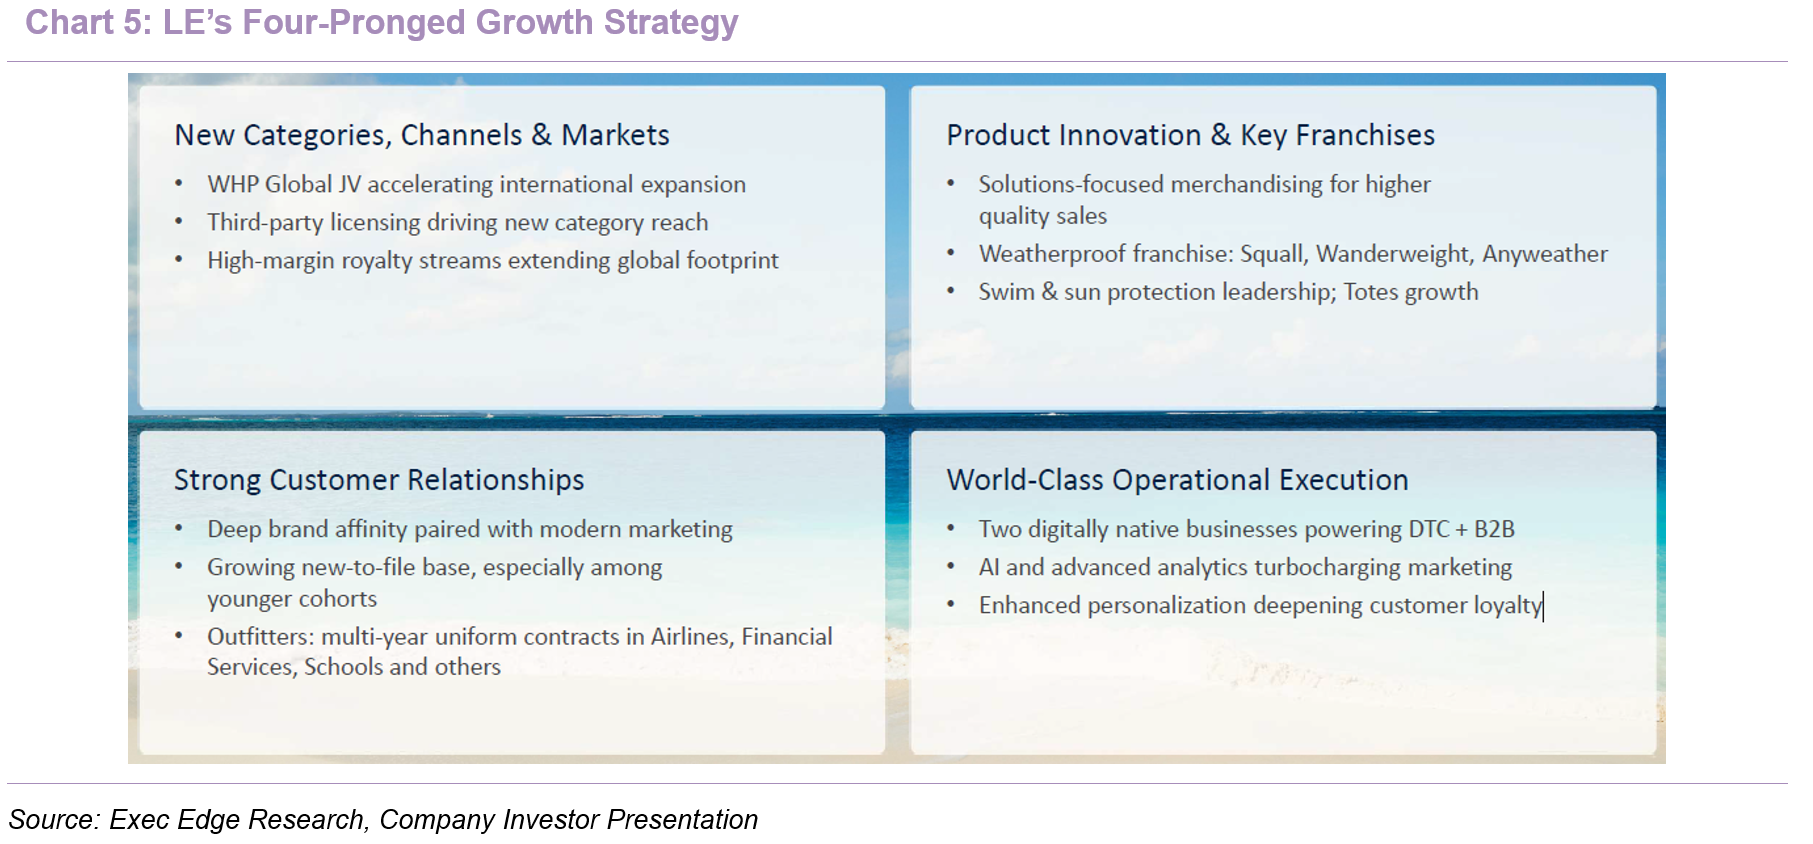
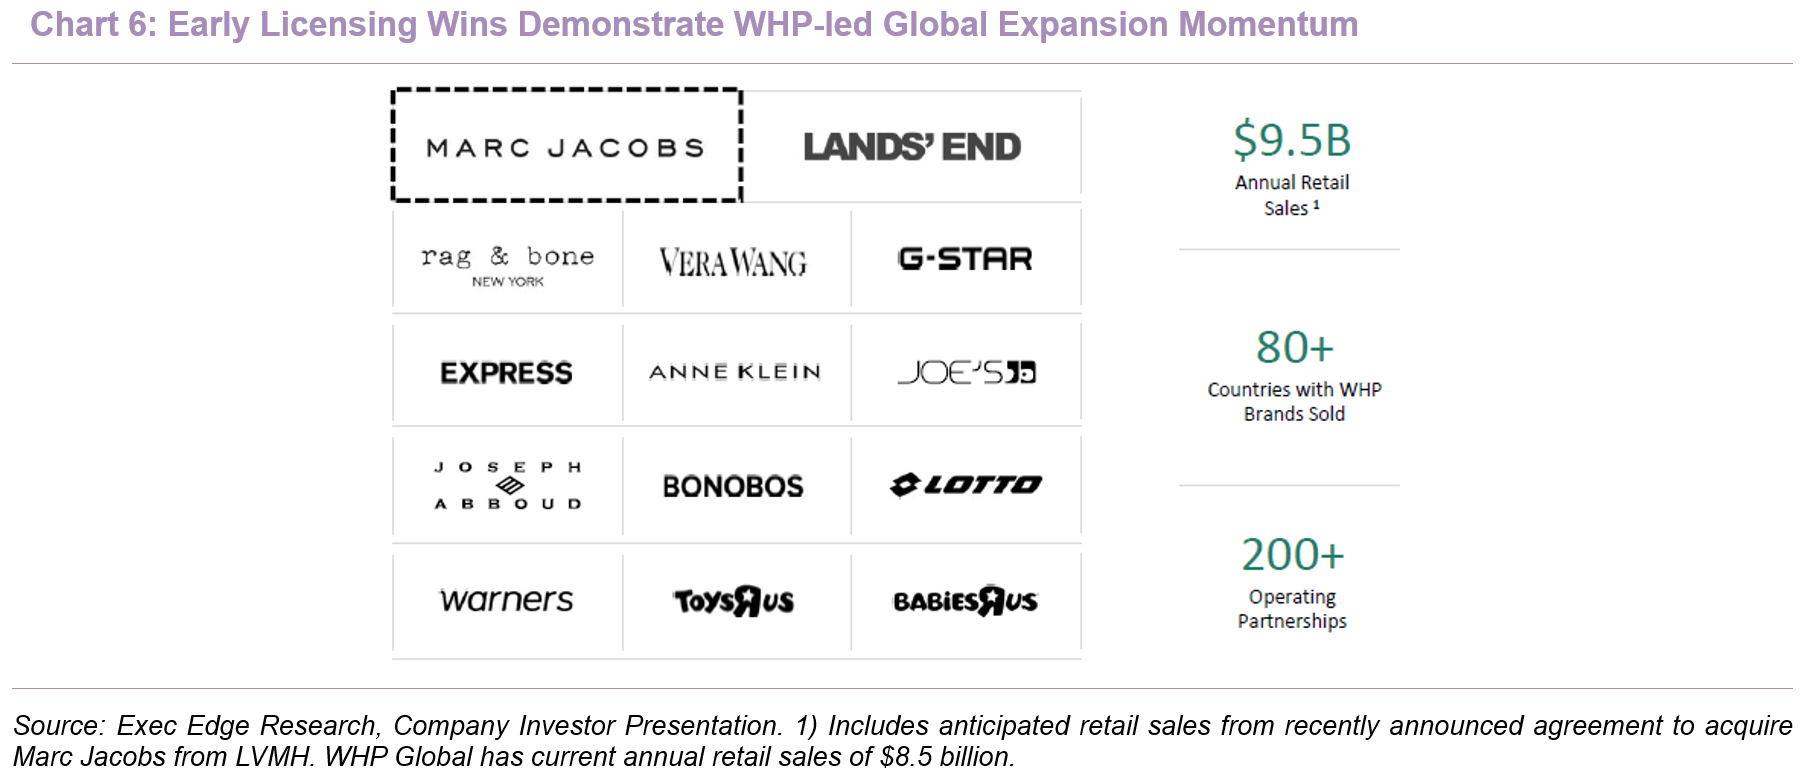
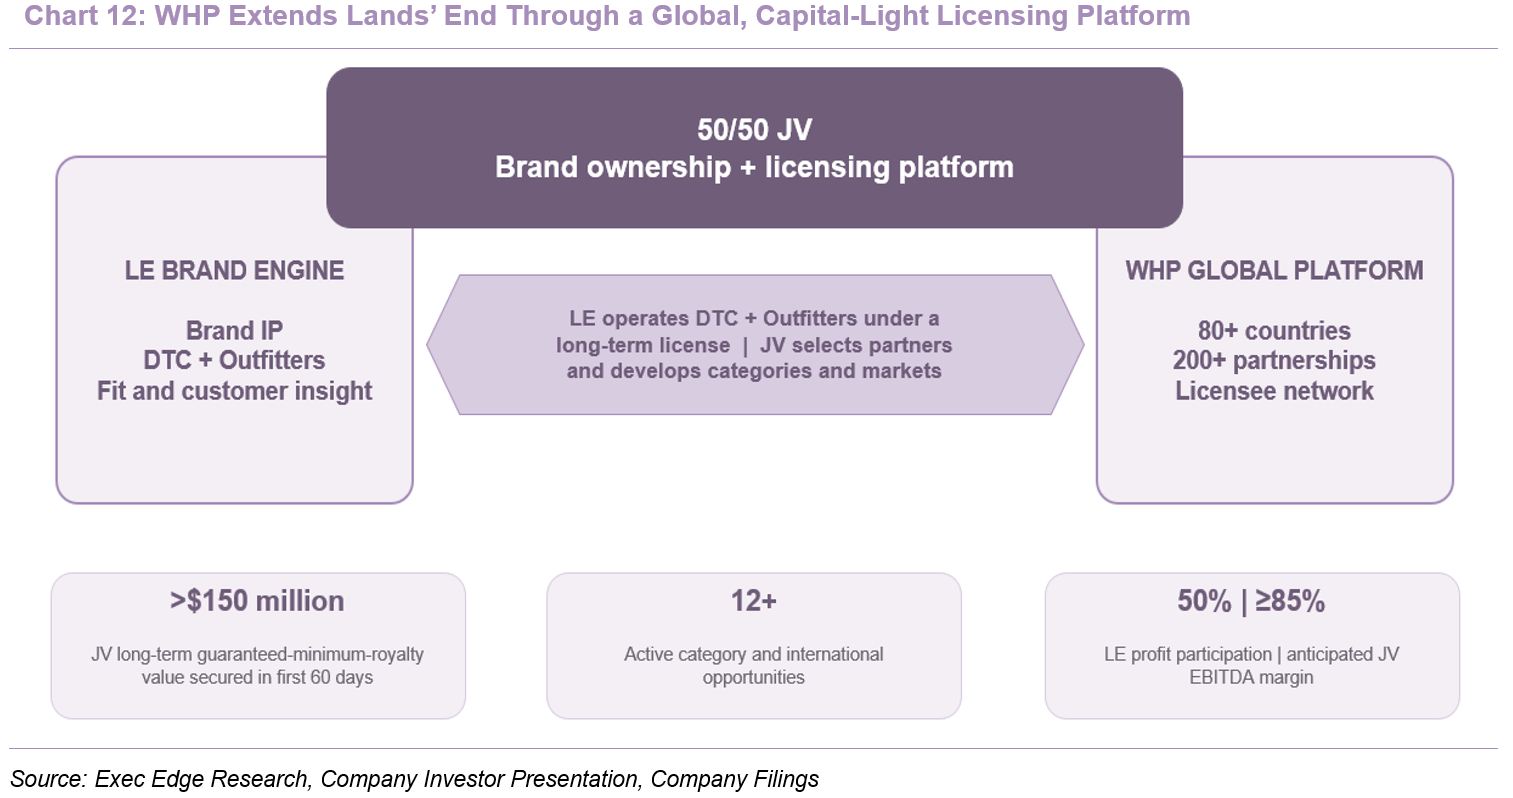
- WHP’s global licensing platform provides a capital-light path into new categories and international markets. LE is using the WHP JV to extend brand reach without carrying the full operating burden of expansion. The post-transaction model leaves LE responsible for DTC and Outfitters execution while the JV, led by WHP Global, pursues third-party licenses across categories, channels and markets where LE does not currently operate. This creates a capital-light route to widen distribution and participate in incremental licensing profits without requiring LE to build local infrastructure or category capabilities internally. Early activity provides evidence of the execution path: within approximately 60 days of closing, the JV consolidated and extended three apparel licenses through 2033, reached an agreement in principle to extend its footwear partnership by seven years and selected a new home-textiles partner after a competitive process. These actions are expected to generate more than $150 million of guaranteed minimum royalties over the lives of the agreements, while more than 12 additional category and international opportunities were active. LE also receives 50% of JV profits, net of expenses, through quarterly distributions, aligning the expansion strategy with recurring distributions. We believe the early licensing pipeline supports the rationale for using WHP’s platform to accelerate brand monetization. The $150 million represents cumulative guaranteed minimum royalties over the lives of the agreements, while the timing and amount of LE’s distributions will depend on licensee performance and overall JV profitability.
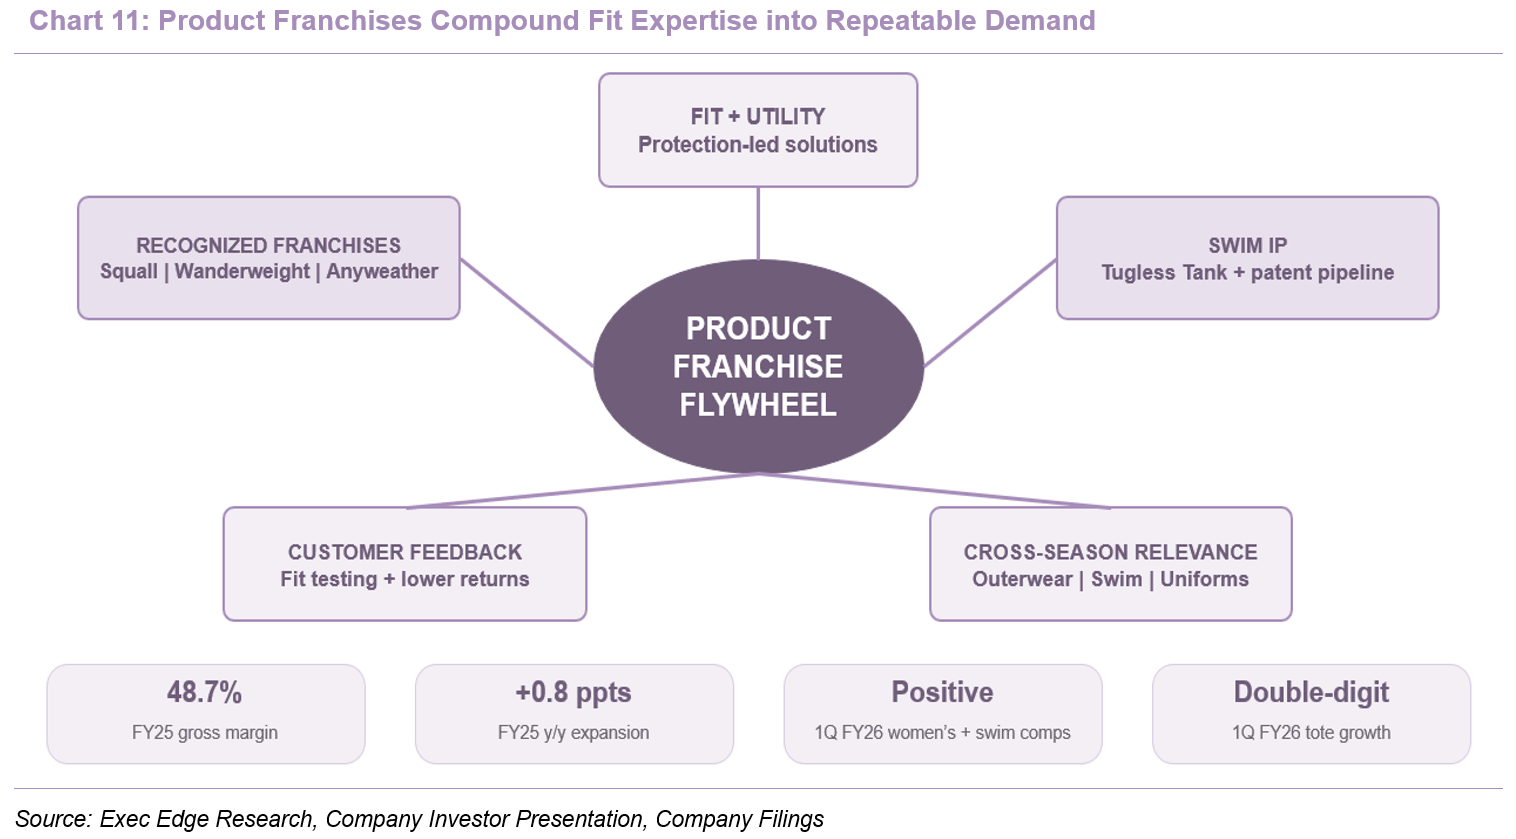
- Franchise-led innovation concentrates investment behind recognizable solutions that can support repeat demand and better inventory productivity. Management is organizing innovation around weather, swim and functional carry solutions rather than broad, undifferentiated category expansion. Outerwear programs include Squall, Wanderweight and Anyweather, while swim franchises include Tugless, Slender and Slender Lite; totes provide an additional franchise in which function, personalization and gifting can reinforce both revenue and customer acquisition. Execution is already visible in current trading. Women’s apparel and swim generated positive comps in 1Q FY26, product and set improvements contributed to lower return rates, and totes continued to grow at a double-digit rate. In Europe, the shift to a franchise-first assortment simplified the range and improved inventory efficiency, supporting 15% y/y revenue growth and approximately 70 bps of gross-margin expansion in 1Q FY26, a period unaffected by the U.S. distribution-center disruption. This strategy should help LE concentrate product development, marketing and inventory behind recognizable programs that remain relevant across seasons. We believe the principal opportunity is to turn a smaller number of differentiated franchises into larger, more repeatable businesses, supported by continued newness in color, print, fit and functionality.

- Customer acquisition, personalization and cross-category engagement can expand lifetime value across DTC and Outfitters. LE is broadening customer reach through coordinated brand marketing, experiential activations and increasingly personalized digital engagement. The growth plan combines contemporary creative, swim-focused events, the Nantucket pop-up and localized European content to reach consumers in relevant settings, while AI and advanced analytics are intended to improve audience selection, message timing and product recommendations. Personalization, particularly across totes and gifting, provides a mechanism to deepen engagement after the initial purchase, while cross-category merchandising can move customers from an entry product into apparel, swim and outerwear. Outfitters supports the same objective by introducing school-uniform households and employees to the broader consumer assortment without requiring a separate acquisition platform. The strategic priority is therefore to improve the quality and lifetime value of acquired demand rather than maximize traffic alone. LE intends to evaluate progress through repeat purchasing, cross-category conversion, full-price demand and retention.

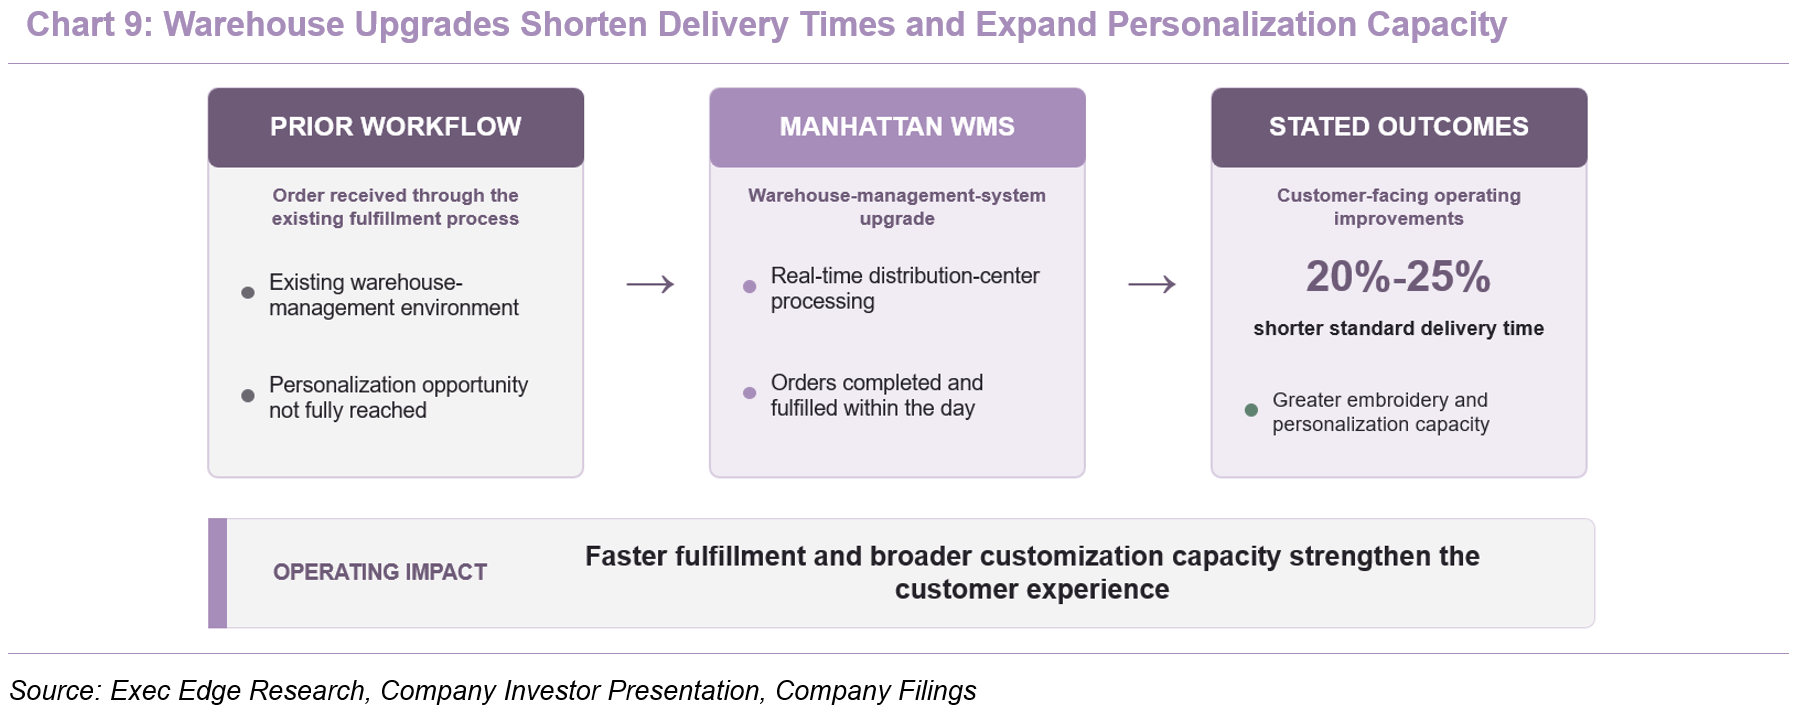
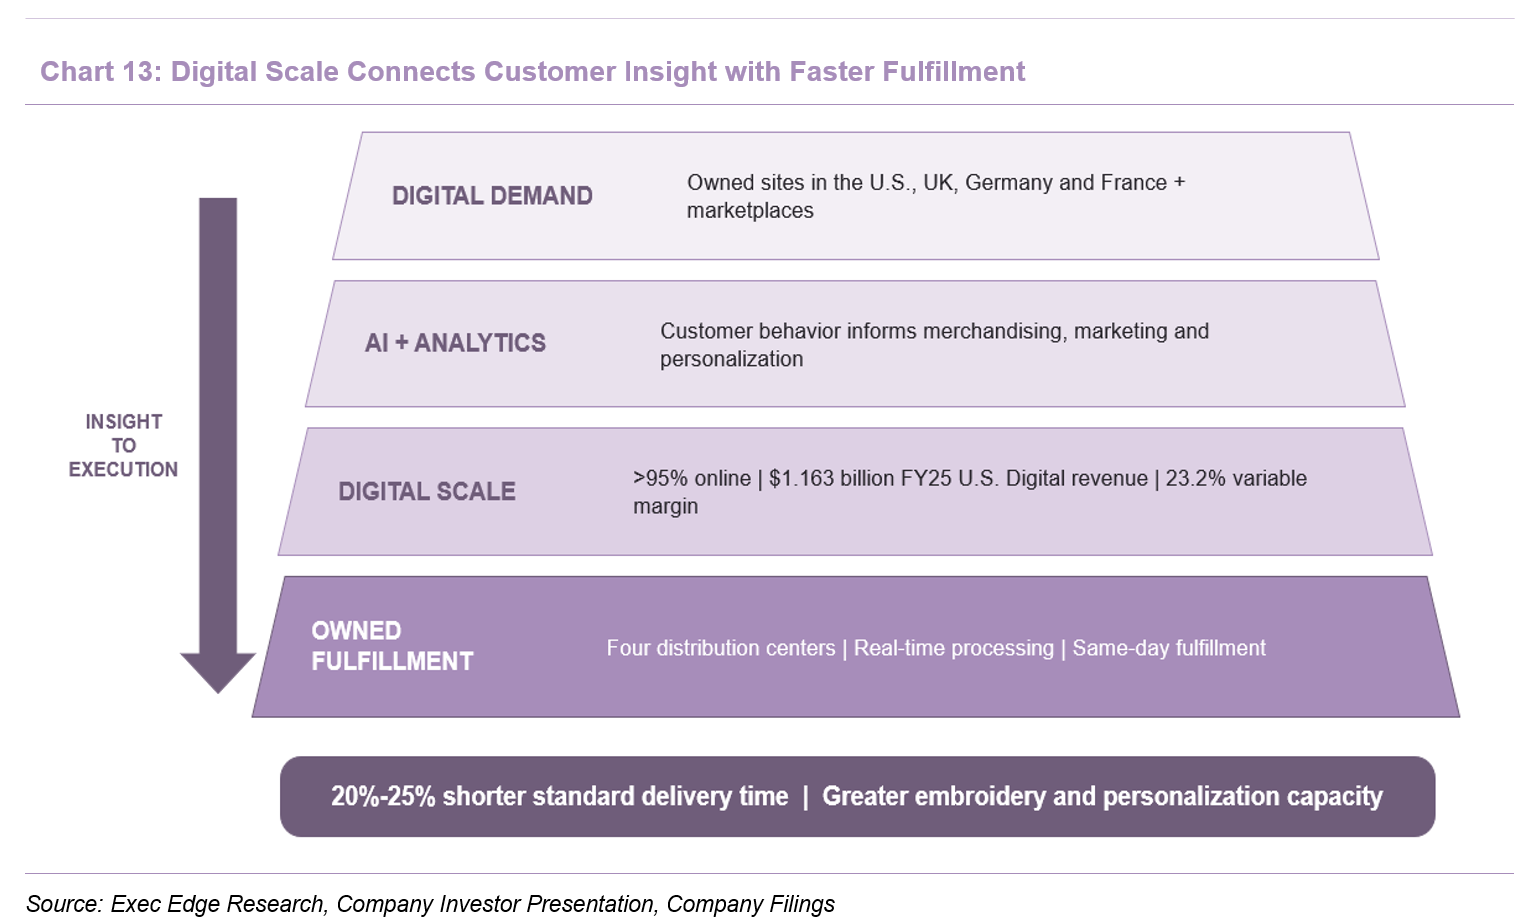
- Technology and fulfillment investments are designed to improve delivery speed, personalization and digital conversion. LE is upgrading technology and fulfillment capabilities to convert digital demand into faster, more personalized customer experiences. The Manhattan warehouse-management-system rollout moved distribution-center operations to real-time processing and enables orders to be completed and fulfilled within the day, which management expects to shorten standard delivery times by 20%-25%. The platform also creates a path toward Amazon Prime badging and expands the capacity available for embroidery and personalization, linking fulfillment investment directly to marketplace reach and differentiated product customization. Beyond logistics, LE is deploying AI and advanced analytics to improve marketing precision, reach customers at more relevant moments and convert more first-time buyers into repeat purchasers. The broader technology program includes SAP, which represents the majority of FY26’s planned approximately $40 million of capital expenditure and is expected to establish a more scalable operating backbone after implementation. Execution remains the central issue, as the initial warehouse rollout temporarily delayed shipments and contributed to the 1Q FY26 revenue decline. Management stated that the backlog was cleared and the network had returned to steady-state operation by the June call. We believe the combination of faster fulfillment, better data and expanded personalization can lift conversion and service quality, with sustained revenue recovery and operating leverage providing the key evidence of successful execution.
Right-to-Win
Product, Customer and Platform Advantages Create a Multi-Dimensional Moat
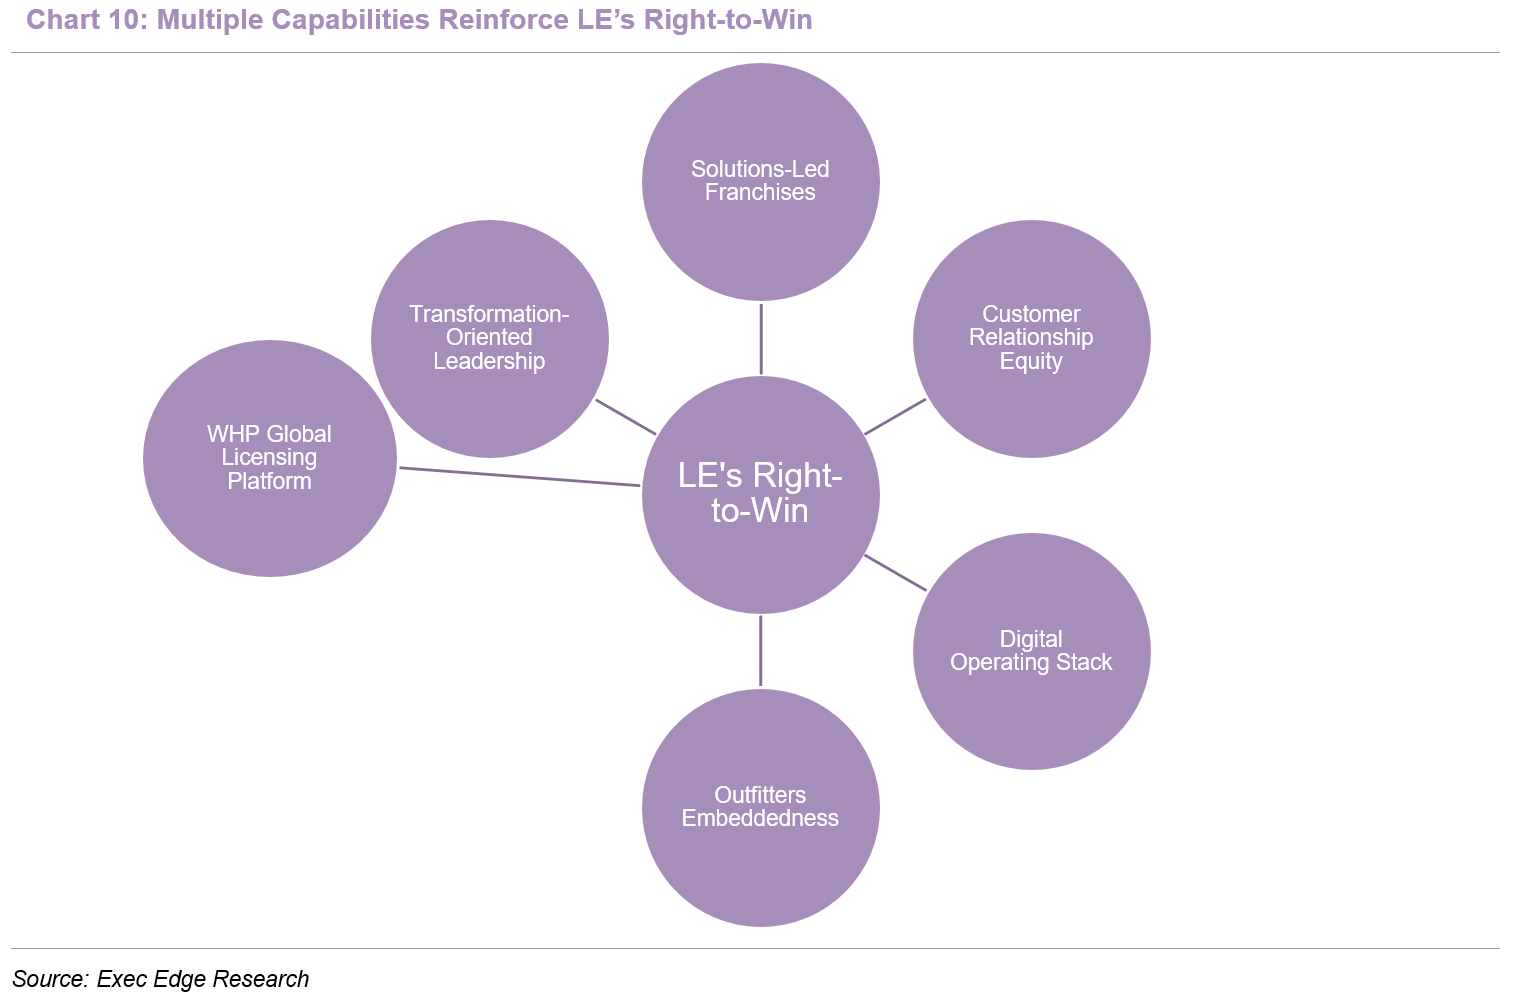
- We believe LE’s right-to-win rests on mutually reinforcing product, customer, operating, and licensing capabilities. Solutions-led franchises and accumulated fit expertise create differentiated purchase occasions, while long customer relationships generate first-party insight that supports merchandising, acquisition and retention. A predominantly digital model connects these insights with owned fulfillment and personalization infrastructure, and Outfitters adds recurring demand through embedded school and enterprise relationships. The WHP JV extends the brand into new categories and markets through a capital-light licensing platform, creating additional licensing-profit participation and monetization potential. Newly appointed CEO Charlie Cole adds digital-commerce, AI, and transformation experience, supported by an experienced leadership bench across finance, product, technology, marketing, Outfitters, and Europe, as LE moves from restructuring toward execution. Together, these capabilities reinforce demand durability, customer economics and capital-light brand expansion, setting the stage for the leadership team to translate LE’s strengthened platform into consistent execution.
- A key tenet of LE’s moat is its ability to compound fit expertise and product-specific IP across repeatable customer needs. Rather than competing only on seasonal fashion, LE builds around fit, protection and utility across swim, outerwear, bottoms, uniforms and totes. This approach is reinforced by owned marks including Squall, Wanderweight, Anyweather, Tugless Tank and Beach Living, plus pending patent protection for targeted-control swimwear and a provisional patent for removable-wire swimwear. The breadth of recognized franchises, supported by trademarks, fit expertise and selected pending patent applications, allows product improvements to compound within recognized platforms instead of requiring LE to recreate demand each season. Recent product and set improvements also contributed to lower return rates, providing evidence that LE’s accumulated fit and product expertise can translate into better customer outcomes.
- The franchise mix spans the calendar, as weatherproof outerwear addresses cold and transitional seasons, swim and sun protection support warm-weather demand, and uniforms create recurring back-to-school and enterprise occasions. This diversification supports inventory productivity and reduces reliance on a single fashion cycle, while sustained productivity will depend on disciplined assortment management and promotional control. We believe the replication barrier lies in the combination of product-specific IP, established fit knowledge, quality testing, customer feedback and franchise recognition, which is more difficult to reproduce than an individual silhouette or fabric innovation.
- Long-standing customer relationships give LE a durable base of repeat demand and proprietary first-party insight. The average customer relationship spans approximately 20 years, and the customer model connects school uniforms with broader DTC purchases over time, allowing one household to engage across categories and life stages. This is economically important because U.S. eCommerce generated $829.8 million, or 62.1% of FY25 revenue, giving LE a sizeable owned-channel base from which to cross-sell without depending entirely on wholesale access. The customer base is also broadening, with new-to-brand acquisition increasing at a low-single-digit rate in 1Q FY26, social followership growing more than 30% year over year and traffic rising at a mid-teens rate across U.S. digital channels. Totes remain the leading entry product for younger new-to-file customers, indicating that customer longevity is not solely a legacy-base feature.
- LE can then use purchase history, fit preferences, price response and personalization choices to sharpen targeting, reinforce loyalty and move buyers across franchises. The model is supported by service access through phone, chat, email, text, social media and self-service, preserving the high-touch heritage within a digital experience. While LE’s high-low pricing architecture means promotions remain part of how long-tenured customers shop, we believe the first-party relationship provides a better basis for targeted offers than undifferentiated discounting. We believe this accumulated customer history, proprietary insight, and multigenerational trust create a relationship advantage that competitors cannot readily replicate through marketing spend alone.
- WHP’s global licensing platform extends LE’s brand into new categories and markets without requiring incremental operating infrastructure or inventory investment. LE contributed its brand IP and existing licenses to the 50/50 JV, while WHP supplies a platform spanning more than 80 countries and over 200 operating partnerships. The structure separates two complementary engines: LE retains DTC and Outfitters under a long-term license, while the JV selects licensees, expands categories and develops markets outside LE’s core operating scope. Initial activity across apparel, footwear and home textiles demonstrates that WHP’s partner network can convert brand recognition into contractual opportunities without requiring LE to build local infrastructure or carry incremental inventory. LE receives 50% of JV profits net of expenses through quarterly distributions, and the JV is anticipated to operate at a profit margin of at least 85%, creating a high-margin earnings stream alongside operating cash flow. We believe the replication barrier lies in the combination of established brand IP, WHP’s global partner network, licensee-selection capabilities and LE’s contractual participation in JV economics.
- LE’s digitally native commerce and fulfillment platform integrates customer data, demand generation and operational execution across DTC and B2B. More than 95% of the business is transacted online, while the U.S. Digital segment generated $1.163 billion of FY25 revenue and $269.6 million of variable profit at a 23.2% margin. This scale supports continued investment in AI, analytics, personalization and enterprise systems across owned sites in the U.S., U.K., Germany and France, as well as marketplaces such as Amazon and Nordstrom. The physical layer is substantial: LE owns three Wisconsin distribution centers and a U.K. facility, supporting both consumer orders and complex uniform programs. The Manhattan warehouse-management-system upgrade links digital demand with LE’s owned fulfillment and personalization infrastructure.
- The platform also provides a foundation for more precise marketing, as AI and advanced analytics can pair first-party behavior with product, timing, and channel decisions. FY25 U.S. Digital variable profit increased $4.2 million and its margin expanded 0.2 ppts despite modest revenue growth, providing evidence that the model can produce operating leverage when fulfillment is stable. The advantage lies not in any single website or warehouse system, but in the integrated combination of customer history, digitally enabled merchandising, owned fulfillment capacity and personalization workflows. Recreating this operating stack would require substantial capital and years of accumulated execution experience, while LE must still complete SAP implementation and sustain normalized service levels to fully realize the benefit.
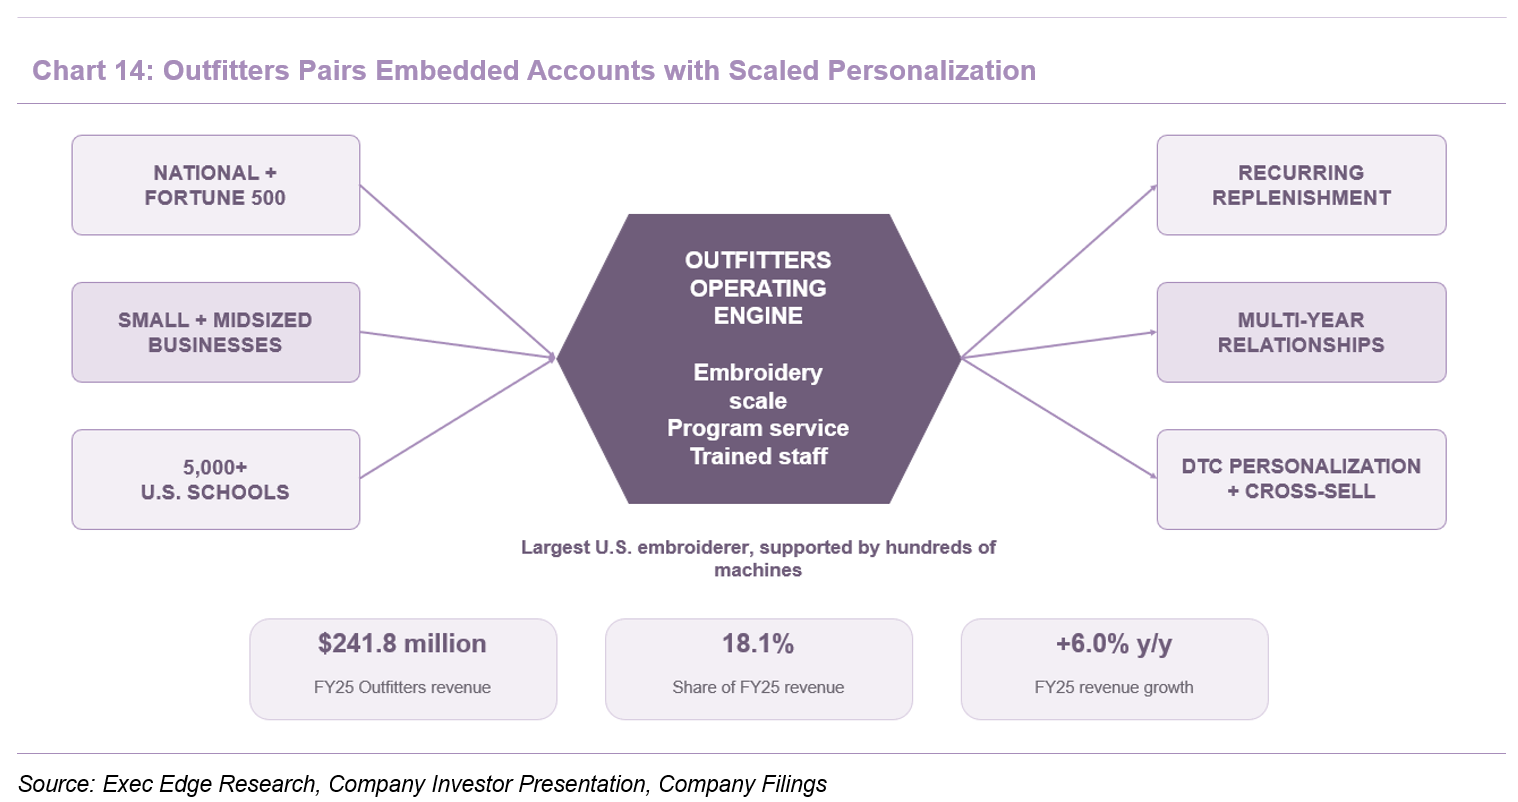
- Strong underlying orders and a growing pipeline reinforce Outfitters’ recurring demand profile despite the 1Q FY26 fulfillment disruption. Outfitters serves national accounts, Fortune 500 companies, small and midsized businesses, and more than 5,000 U.S. schools, combining branded uniforms with embroidery, service and program administration. The channel generated $241.8 million in FY25 revenue, 18.1% of LE’s total, and grew 6.0% year over year as the school uniform business added customers and selected enterprise accounts expanded. The revenue base is reinforced by multi-year uniform relationships across airlines, financial services, schools and other organizations, where consistent fit, replenishment, logo execution and service reliability matter as much as garment design. LE is the largest embroiderer in the U.S., supported by hundreds of machines and trained staff, and is applying light-manufacturing processes to raise throughput. That installed capability supports complex B2B orders while also enabling DTC personalization, allowing the same fixed infrastructure to serve two revenue pools and improve utilization.
- Outfitters’ recurring relationships and embedded workflows indicate that the 1Q FY26 decline reflected fulfillment timing rather than weakening customer engagement. Outfitters also provides an acquisition bridge into DTC, as school-uniform households can enter the broader LE customer ecosystem. The moat combines trusted account relationships, program-specific service requirements, embroidery capacity and the operating history needed to deliver reliably at institutional scale. While a new entrant can source blank apparel, recreating the embedded workflows, customer approvals and recurring replenishment relationships would be considerably more difficult.
- LE’s leadership bench combines transformation continuity with digital, operating and functional expertise for the execution-intensive post-JV phase. Charlie Cole became CEO and joined the Board on July 13, 2026, bringing more than two decades of experience across digital commerce, technology, AI and omnichannel retail, including leadership roles at Thuma, XGen AI, Tribute Technology, FTD, TUMI and Samsonite. Cole is supported by Bernard McCracken’s public-company finance and controls experience, Martin Christopher’s technology and systems leadership, Kym Maas’ product and merchandising expertise, John DeFalco’s Outfitters and institutional-business background, Sarah Sylvester’s brand and performance-marketing experience, and Andy Houghton’s international and digital-market development capabilities. Andrew McLean’s advisory transition should preserve institutional knowledge of the solutions-based strategy and WHP transaction. Together, this leadership mix strengthens LE’s ability to coordinate JV commercialization, SAP implementation, fulfillment stabilization, customer acquisition and international growth, although the advantage will ultimately depend on execution across the organization rather than any single executive.
Industry Trends and Company Positioning
LE Is Positioned in Higher-Growth Digital and Uniform Channels Within the Apparel Market

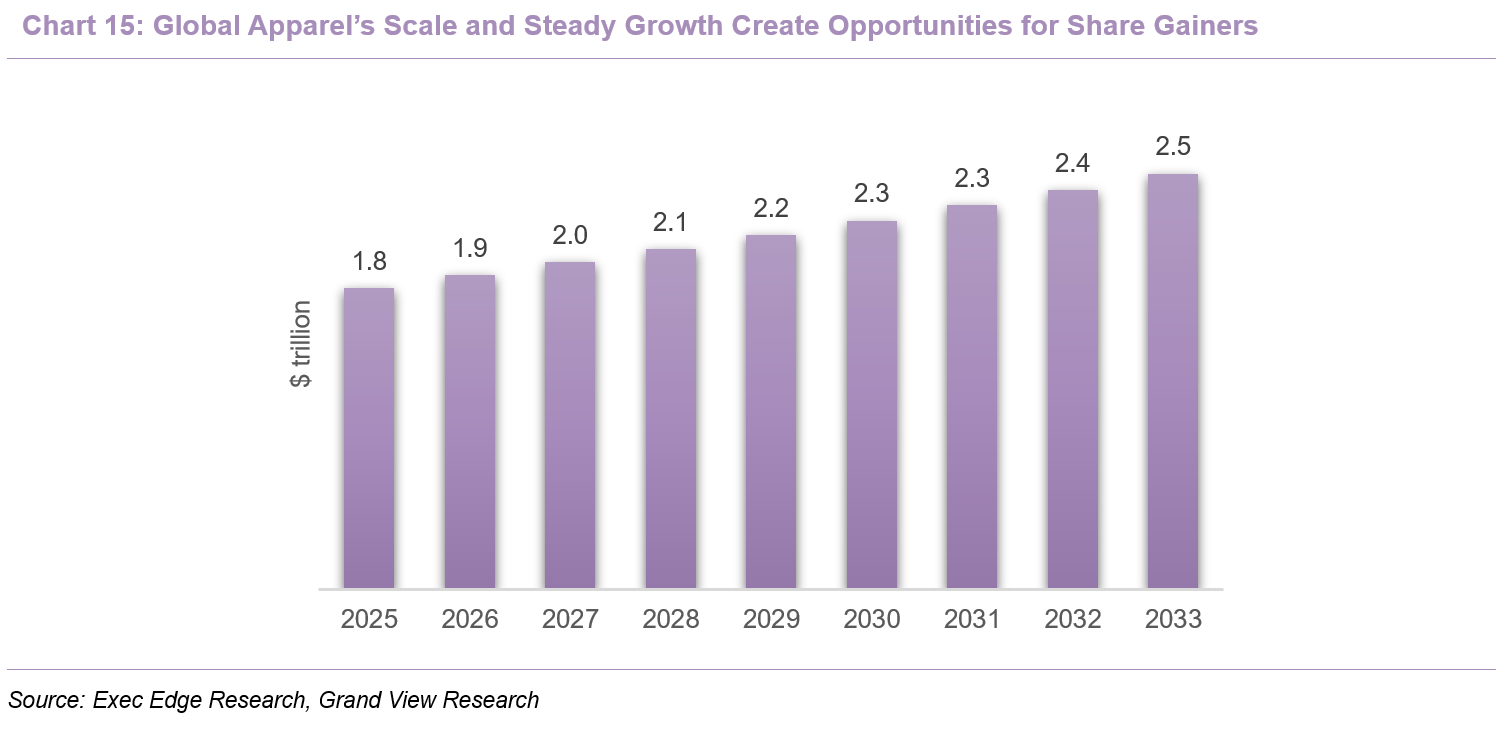
- Global apparel is large but structurally mature, making channel exposure and share gains more important than category growth alone. Grand View Research estimates that global apparel revenue reached $1.84 trillion in 2025 and should approach $1.9 trillion in 2026 before growing to $2.54 trillion by 2033, representing a 4.1% CAGR. The market remains anchored in high-volume, price-sensitive consumption, with mass apparel accounting for 67.8% of 2025 revenue, women’s apparel representing 51.4% and offline channels retaining a 78.3% share. Asia-Pacific generated 40.8% of revenue, providing the largest regional growth base as urbanization, rising household incomes and broader access to organized retail increase per-capita apparel spending. Casualization, performance fabrics, size-inclusive assortments and greater product availability through digital channels should support demand, while e-commerce and DTC models allow brands to extend their reach without requiring equally rapid physical-store expansion. Overall, the market’s scale and steady growth create meaningful opportunities for brands with differentiated products, strong digital reach and the ability to gain share across faster-growing channels.
- Consumer caution and trade volatility increase the importance of brand relevance, sourcing flexibility and inventory discipline. The BoF-McKinsey State of Fashion 2026 survey found that 78% of fashion executives viewed consumer confidence and willingness to spend as a leading growth risk, while 40% cited disrupted trade flows and deglobalization. Tariffs and sourcing volatility can raise landed costs before retailers have confidence that consumers will accept higher prices, forcing suppliers, brands and customers to divide the burden. At the same time, value-seeking behavior, off-price competition and resale make full-price conversion harder, while rapidly changing trends increase inventory and markdown risk. Traceability requirements may improve supply-chain visibility but can also increase compliance and data-management costs. Consequently, aggregate growth is likely to depend more on emerging-market consumption, digital penetration and category-specific share shifts than on a broad acceleration in apparel volumes. For LE, this environment increases the value of differentiated product franchises, disciplined inventory planning and sourcing flexibility as it seeks to outperform underlying category growth.
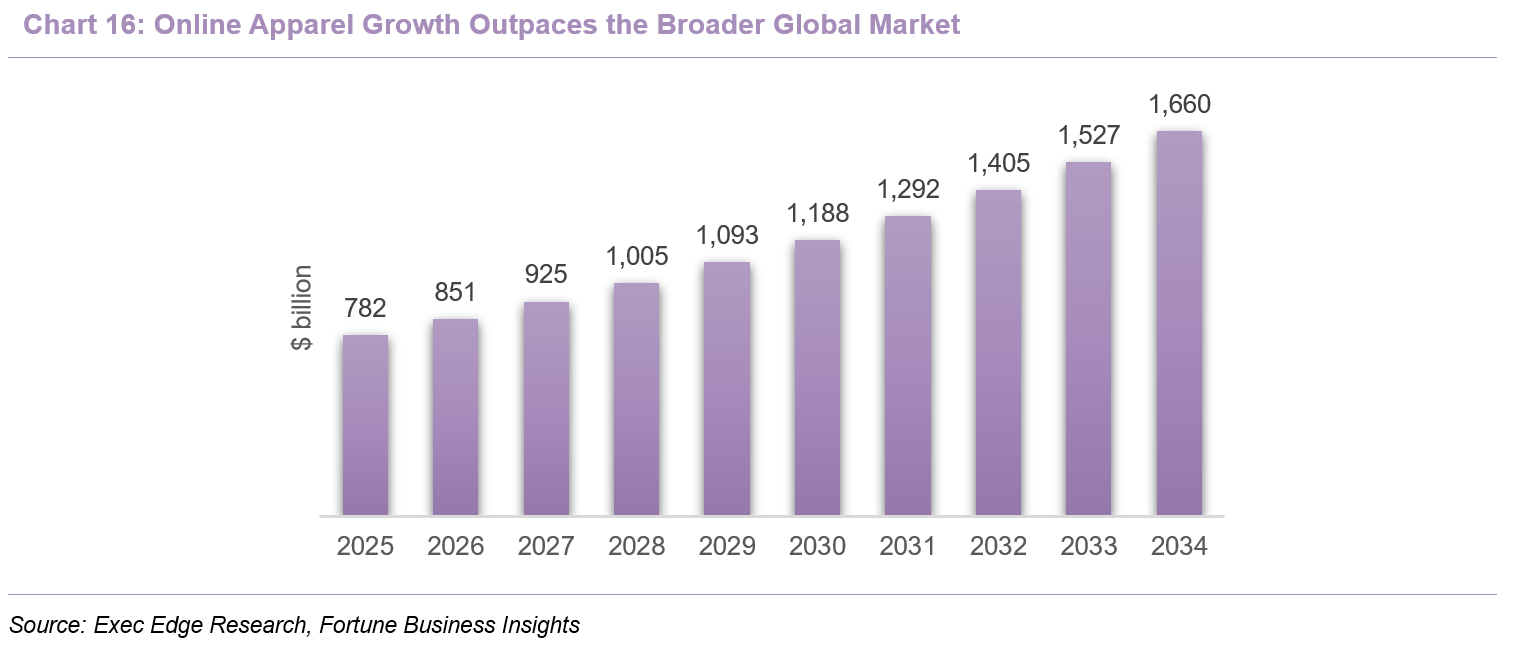
- Apparel e-commerce should continue outgrowing the broader category, but durable value will accrue to brands that pair digital reach with strong execution. Fortune Business Insights estimates that global e-commerce apparel sales increased from $782 billion in 2025 to $851 billion in 2026 and should reach $1.66 trillion by 2034, representing an 8.72% CAGR. Growth is being supported by smartphone penetration, digital payments, broader delivery coverage and the convenience of comparing products across brands and marketplaces. Social commerce, AI-supported product discovery, personalized recommendations and virtual fitting tools should further reduce search friction and improve merchandising relevance. DTC models also provide brands with greater control over customer data, pricing, product presentation and post-purchase engagement, enabling faster assortment and marketing decisions.
- However, channel growth does not automatically translate into attractive economics. Low barriers to entry intensify competition for traffic, raising customer-acquisition and promotional costs, while consumers increasingly expect rapid delivery and simple returns. The National Retail Federation estimates that 19.3% of online sales were returned in 2025, with 82% of surveyed consumers viewing free returns as important. Apparel faces particular exposure because fit, color and fabric can be difficult to assess online, adding reverse-logistics, handling and markdown costs. Profitability should therefore favor brands that combine differentiated products, repeat purchasing, accurate fit information and reliable fulfillment with disciplined acquisition spending.
- Uniforms offer a more resilient growth profile than mainstream apparel because demand is recurring, contract-led and tied to employment or enrollment. Research and Markets estimates that the broad uniforms and workwear market should increase from $84.75 billion in 2025 to $111.27 billion by 2030, representing a 5.5% CAGR. Demand is supported by workforce expansion across healthcare, hospitality, transportation, construction and other service or industrial sectors, together with safety requirements and employers’ use of standardized apparel for identification and brand consistency. Managed programs can also generate repeat purchasing through employee onboarding, replacement cycles, seasonal requirements and changes in customer branding.
- The school-uniform category offers an additional growth pocket, with Research and Markets forecasting the global market to expand from $18.11 billion in 2025 to $27.81 billion in 2031, representing a 7.41% CAGR. Growth should be supported by enrollment, uniform mandates, online ordering and demand for customized school programs. The model is not without risk: large customers can exercise procurement leverage, tenders can constrain pricing and contract renewals create periodic revenue uncertainty. Providers must also manage size availability, logo and personalization accuracy, replenishment speed and delivery across dispersed employee or student populations.
- Near-term growth is softer than the long-term forecasts imply, but the category should remain comparatively resilient. The TRSA/Baird 4Q25 Textile Rental Survey indicated expected uniform-rental revenue growth of 3.6% over the following 12 months, while base-price growth slowed to 1.4%. Although rental represents only one part of the market, the survey highlights current pricing and customer-budget constraints. Performance should therefore depend less on broad category growth alone and more on retention, service reliability and disciplined contract economics.
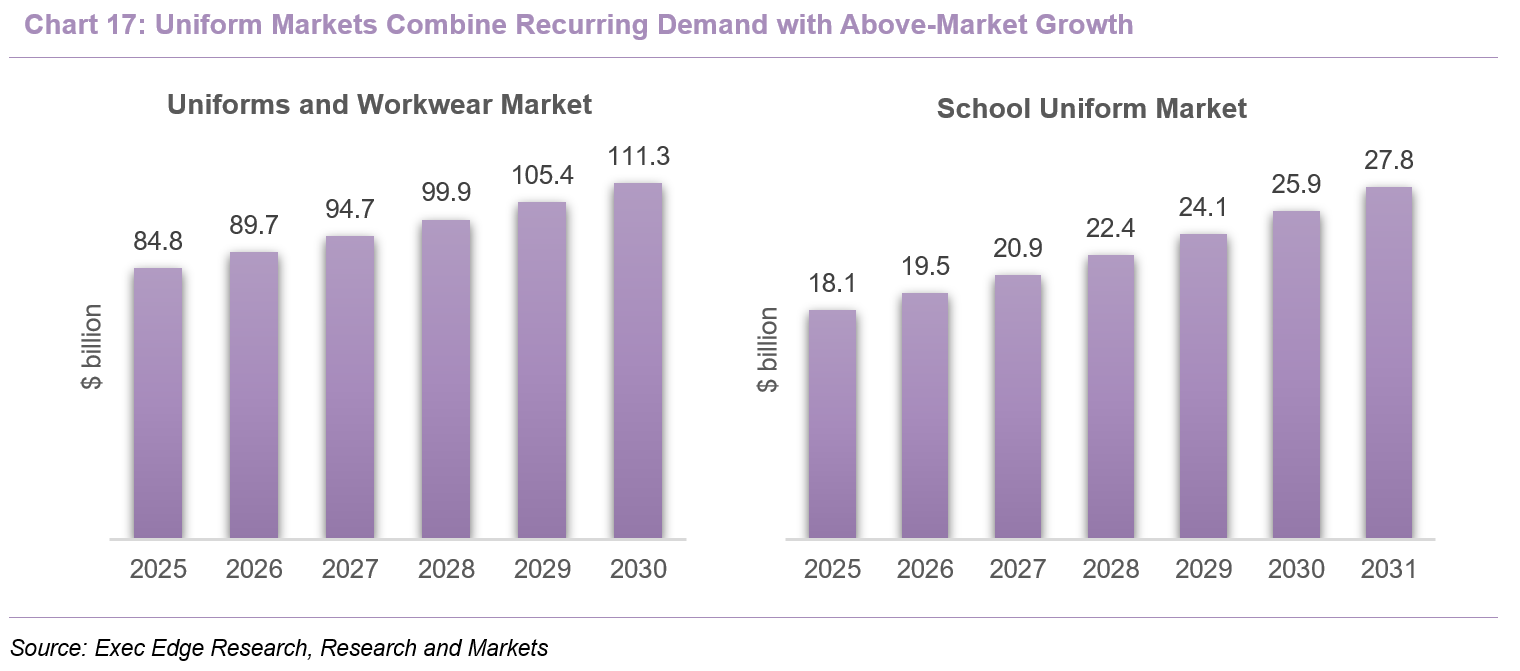
- LE’s channel mix provides meaningful exposure to faster-growing digital and uniform markets. FY25 U.S. e-commerce revenue of $829.8 million represented 62.1% of total revenue, while European e-commerce contributed another $90.2 million, or 6.8%. Outfitters generated $241.8 million, equivalent to 18.1% of revenue, through uniform and promotional-product programs serving businesses and schools. More than 95% of LE’s overall business is conducted online, including digitally enabled B2B ordering, aligning its operating model with the channel shift occurring across apparel. These exposures place a substantial portion of LE’s revenue in end markets forecast to grow faster than the broader category: e-commerce apparel is projected to expand at an 8.72% CAGR and the broad uniforms and workwear market at 5.5%, compared with 4.1% for global apparel.
- These market-growth rates strengthen LE’s opportunity set, but do not by themselves determine its revenue trajectory. In DTC, LE must convert digital traffic efficiently, improve fit and product discovery, control returns and deliver orders reliably. In Outfitters, growth depends on retaining multi-year relationships, winning new programs and fulfilling customized orders accurately and on schedule. We believe LE’s channel mix creates meaningful opportunity for above-market growth, but realization will ultimately depend on execution and share gains rather than industry expansion alone.
Brand Managers Scale Fashion IP Through Licensing and Upmarket Expansion

- Brand-management licensing has evolved into a scaled, capital-light growth model for fashion IP, supported by continued consumer demand for recognized brands. Global sales of licensed merchandise and services reached $389.8 billion in 2025, increasing 5.45% and outpacing 4.52% nominal growth in the broader retail market, according to Licensing International’s study of 1,068 companies across 51 countries. These figures represent consumer sales generated under license rather than royalty revenue retained by brand owners, but they illustrate the substantial commercial base from which royalties are earned. Scale is increasingly concentrated among platforms that aggregate brand IP and connect it with specialist operators across categories and geographies.
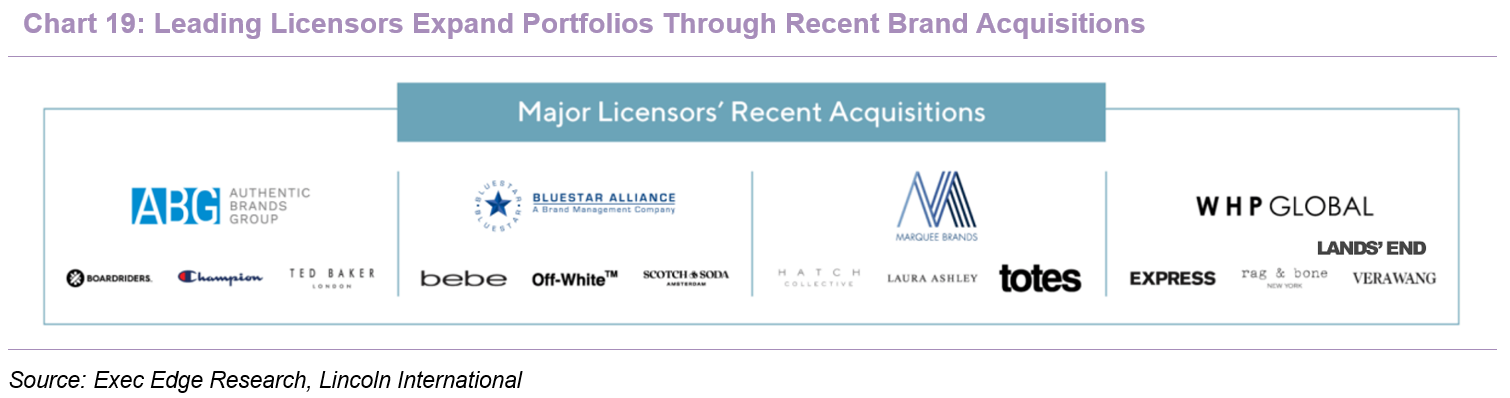
- Scaled brand-management platforms benefit from network effects across brands, partners and markets. Lincoln International identifies WHP Global, Authentic Brands Group, Bluestar Alliance and Marquee Brands as four leading fashion licensors. WHP’s portfolio spans more than 15 brands, over 80 countries and approximately $8.5 billion of global retail sales, while Authentic reports more than 50 brands, over 1,700 partners across more than 150 countries and over $36 billion of annual global retail sales. Bluestar oversees premium fashion and lifestyle brands generating more than $13 billion of global retail sales through over 600 licensees. Each acquired brand broadens a platform’s relevance to retailers and operators, while established partner relationships can accelerate expansion into additional categories and countries. This has created a more institutional market for fashion IP, with scaled brand managers acting as repeat acquirers and portfolio operators rather than one-off buyers.
- Licensing shifts the funding and execution burden from brand owners to specialist operators while preserving participation in IP economics. Under the typical structure described by Lincoln International, the licensor owns the brand and controls its use, while licensees assume functions such as manufacturing, distribution and sales and pay royalties, often subject to negotiated guaranteed minimums. Compared with direct operation, this can accelerate entry into new categories and countries, reduce inventory and working-capital requirements and add local product, regulatory and retail expertise, as illustrated by Rebecca Minkoff’s licensing transition. Portfolio managers can also reuse relationships with retailers, distributors and licensees across brands, extending reach without building a wholly owned operating platform in every market.
- The model trades direct merchandise margin and operating control for lower capital intensity and broader partner-led reach. Brand owners remain exposed to licensee execution, credit quality and brand stewardship, while typically having less control over pricing, distribution and customer data. Guaranteed minimums can improve cash-flow visibility, but realization still depends on contract terms, cure rights and counterparty performance. Fashion Dive’s account of Authentic’s Sperry license highlights the importance of alignment on revenue expectations, distribution, approvals and brand stewardship when the licensee operates the consumer-facing business. We believe licensing creates the most value when specialist partners can execute more effectively than the brand owner could build internally, while enforceable standards protect long-term brand equity.
- Premium fashion is becoming a more important growth frontier as culturally relevant brands offer broader licensing and category-extension potential. Recent transactions include LE’s 50/50 brand-management JV with WHP Global, WHP’s definitive agreement to acquire Marc Jacobs with G-III, Bluestar’s acquisitions of Off-White and Palm Angels, Marquee’s agreement for a majority interest in Roberto Cavalli and Authentic’s completed acquisition of 51% of Guess IP. Vogue Business characterizes this as a shift from distressed or legacy IP toward globally recognized brands that can support licensing, distribution and category expansion across consumer segments. Premium brands bring stronger awareness, distinctive design codes and cultural relevance, which can support international expansion, entry into categories such as beauty, eyewear, home and hospitality, and higher price points. These attributes can create a broader and potentially more durable royalty base than mature mass-market IP, provided product quality and distribution remain consistent with the brand.
- Moving upmarket increases both the monetization opportunity and the importance of disciplined stewardship. Licensing’s bias toward scale can conflict with premium fashion’s dependence on scarcity, creativity and controlled availability, while rapid category proliferation, excessive off-price exposure or weak licensees can dilute the equity that justified the acquisition. The emerging model therefore combines centralized IP ownership with capable operators and creative continuity: Marc Jacobs is expected to remain creative director, G-III will manage the global operating business and WHP will oversee licensing. The opportunity set is expanding, but successful execution will depend on extending reach without weakening brand identity or customer relevance.
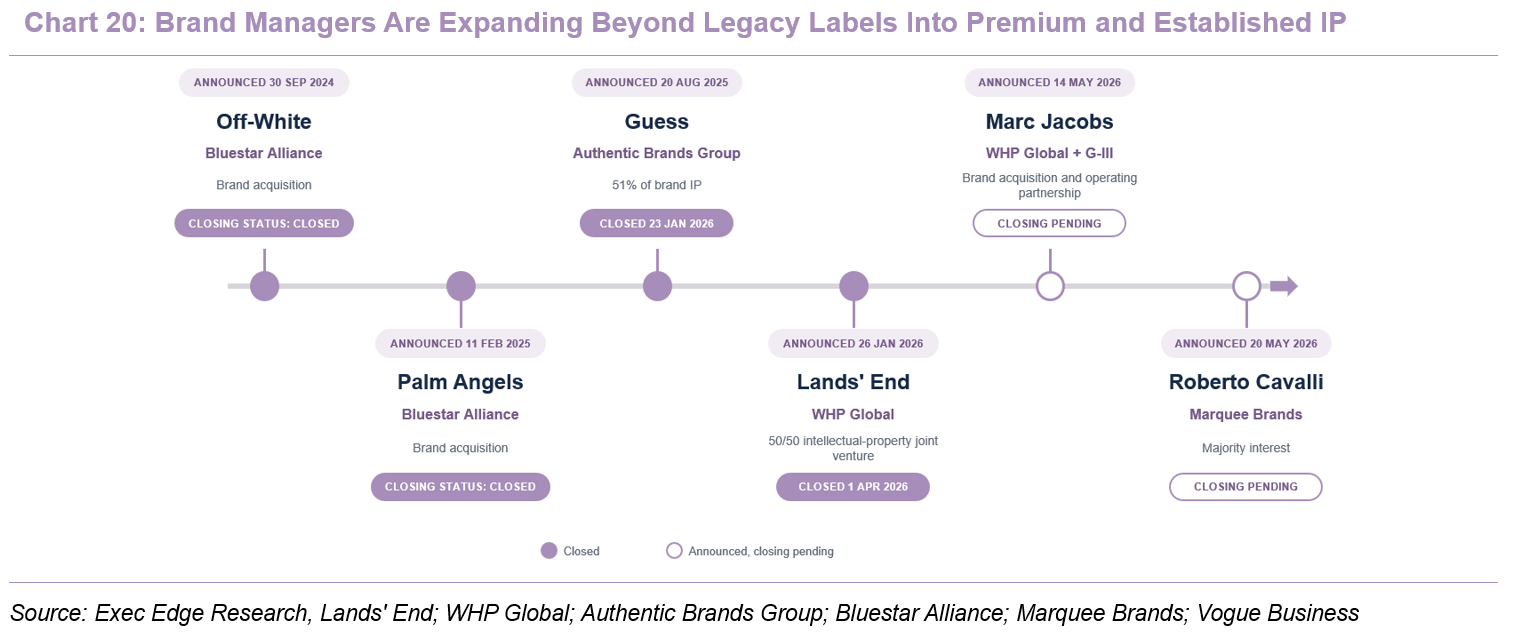
- LE’s WHP JV applies the brand-management industry’s capital-light model to the Lands’ End brand, extending category and geographic reach while preserving LE’s DTC and Outfitters base. LE contributed its IP and existing licenses to the JV, after which WHP acquired a 50% controlling interest for $300 million; LE used the proceeds to repay its term loan. WHP controls the JV and leads category, partner and geographic expansion. Under the long-term license, LE pays the JV at least $50 million annually and receives 50% of JV profits through quarterly distributions, preserving participation in existing royalties and future licensing growth. The structure combines WHP’s partner network with LE’s customer and operating capabilities without requiring LE to fund inventory or local infrastructure for each licensed opportunity. It materially reduced leverage while retaining exposure to future brand monetization. Returns will nevertheless depend on licensee selection, governance and contract durability, while the royalty burden lowers LE’s reported gross margin. We view the JV as a complementary growth and monetization engine whose value will ultimately depend on disciplined execution across LE’s retained operating businesses.
- LE also retains event-driven optionality through a right, and in some circumstances an obligation, to exchange its 50% JV interest for WHP Global equity following a qualifying monetization event. Management’s hypothetical scenarios indicate potential incremental event value of approximately $22-$38 per share, based on $100-$150 million of JV EBITDA and 13x-15x transaction multiples. We note that these are hypothetical event-value scenarios, not guidance or current fair value, and realization depends on a qualifying WHP transaction and the ultimate exchange terms.
Fit, Function and Accessible Value Strengthen LE’s Positioning

- Value is becoming a more important source of differentiation as pressured consumers scrutinize both price and product quality. The EY Future Consumer Index 2025 found that 73% of U.S. consumers changed buying behavior after price increases during the prior year, while 50% ranked price as the most important purchase factor. Clothing and footwear remained comparatively resilient, but 31% still reported reducing quantities or trading down within the category. The BoF-McKinsey State of Fashion 2026 similarly found that 27% of consumers were shopping at lower-priced retailers than usual, while the value and discount segment’s share of positive economic-profit creators remained elevated at 60% in 2025E. Consumers are also widening their consideration sets across off-price retailers, private labels, resale platforms and ultra-low-cost digital competitors, with secondhand fashion expected to grow materially faster than the firsthand market through 2027.
- We believe durable value propositions must extend beyond price alone. Frequent promotions can encourage customers to delay purchases until discounts appear, while excessive price increases risk losing value-conscious consumers. Mainstream brands must therefore preserve affordability without creating a permanently discounted proposition that weakens brand perception and compresses gross margin. We expect stronger performers to combine accessible price points with dependable quality, practical utility and differentiated products, creating visible value without competing directly with ultra-low-cost platforms.
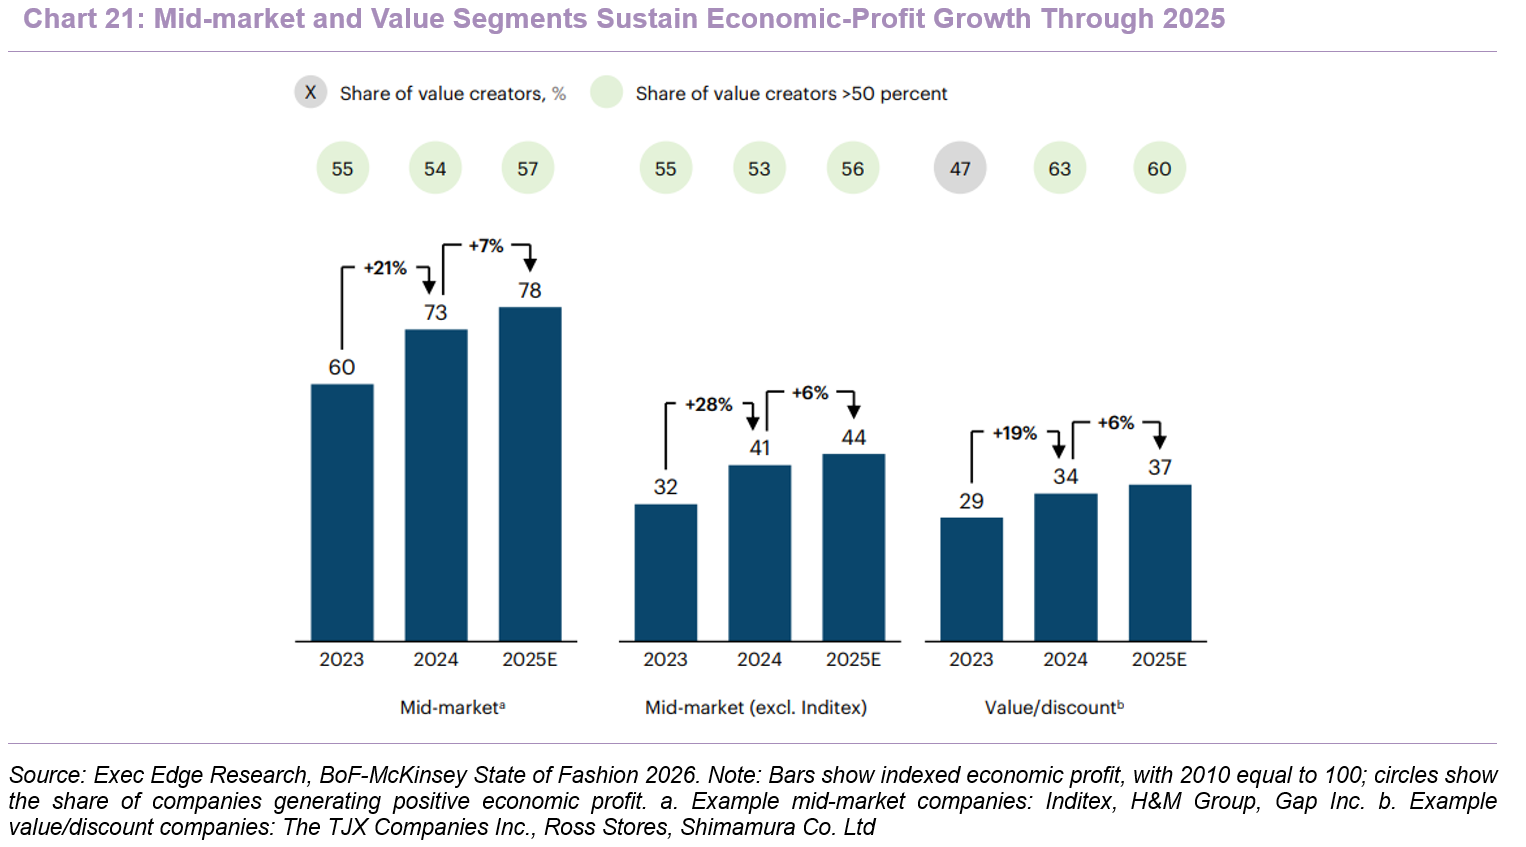
- Consumers increasingly define value through the balance of price, quality and utility rather than ticket price alone. The BoF-McKinsey State of Fashion 2026 reports that 51% of global consumers view product quality as the strongest contributor to high-end brand perception, while 31% remain willing to splurge when craftsmanship or customer experience provides a credible reason. This creates room for accessible brands to elevate selected products without abandoning their core customers. H&M and Bershka reduced the share of U.K. SKUs in their lowest price bands by 15%–25% between 2023 and 2025, illustrating how value players are moving away from direct competition with ultra-low-cost platforms and placing greater emphasis on materials, design and presentation.
- However, product elevation works only when customers can clearly see and experience the added value. A 2025 Vogue Business survey of 687 U.S. and U.K. readers found that cost and quality were each purchase deterrents for 50% of respondents, followed by poor fit at 43% and inconsistent sizing at 36%. An inexpensive garment that fits poorly, performs inconsistently or requires an inconvenient return may therefore represent weak value. Brands must coordinate product architecture and promotional strategy, using accessible opening price points, differentiated hero franchises and selective promotions to convert price-sensitive demand without obscuring the proposition. We believe functional differentiation, durability and dependable fit should increasingly support full-price conversion in the pressured middle market, while price increases unsupported by visible product benefits risk alienating customers.
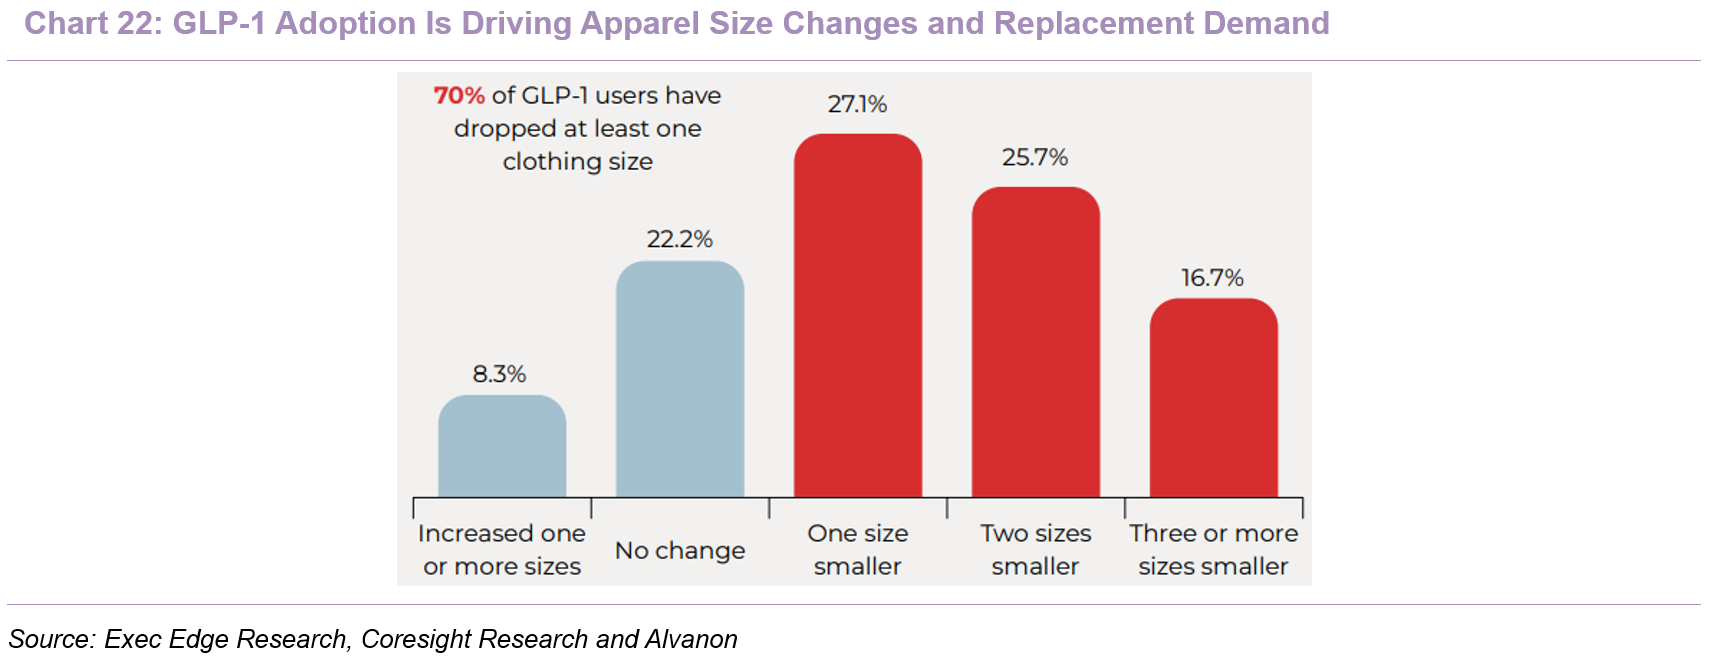
- GLP-1 adoption is creating incremental apparel demand while increasing the importance of flexible sizing and inventory planning. Circana estimates that 23% of U.S. households included at least one GLP-1 user as of fall 2025, up 4 ppts from the prior year. Its survey found that 55% of active users had purchased new clothing or footwear, primarily because their size changed, while one-quarter refreshed their wardrobe to update their appearance. Coresight Research and Alvanon found similar evidence: among 144 U.S. GLP-1 users surveyed in November 2025 and March 2026, 70% had dropped at least one clothing size and 42% had moved down by two or more sizes. These shifts can accelerate replacement purchases across basics, workwear, swimwear and occasion apparel, while making historical demand by size less reliable.
- Retailers with dependable fit capabilities and responsive size planning should be better positioned to capture this demand. Changing customer measurements can increase stock-outs in faster-moving sizes, excess inventory in slower-moving sizes and online returns where sizing information is unclear. Consistent grading, mix-and-match sizing, adjustable fits and detailed garment information can help retailers respond while supporting customer confidence. GLP-1 adoption does not imply a uniform decline in extended-size demand, but it reinforces the value of accurate fit execution and adaptable inventory allocation.
- LE’s solution-led assortment is well aligned with consumers seeking visible value through functionality, dependable fit and accessible pricing. LE develops enduring products using modern fabrics and quality construction, supported by fit testing and product-quality controls. Squall, Wanderweight and Anyweather address weather protection, while Tugless, Slender and Slender Lite combine fit, function and technical features in swimwear. Mix-and-match separates allow customers to select different top and bottom sizes, an increasingly relevant capability as body-size needs become more fluid. LE reinforces this product proposition with pricing discipline, prioritizing higher-quality, full-price demand over low-value promotional volume while retaining a planned high-low architecture for long-standing value seekers. We believe this combination allows LE to compete on problem solving and product performance rather than price alone, supporting conversion without forcing the brand toward the lowest-cost end of the market. Sustaining the advantage will require LE to translate its fit credentials into clear digital product information and adjust inventory size curves quickly enough to limit markdowns and missed demand.
Digital Infrastructure Supports Discovery, Fulfillment and Personalization

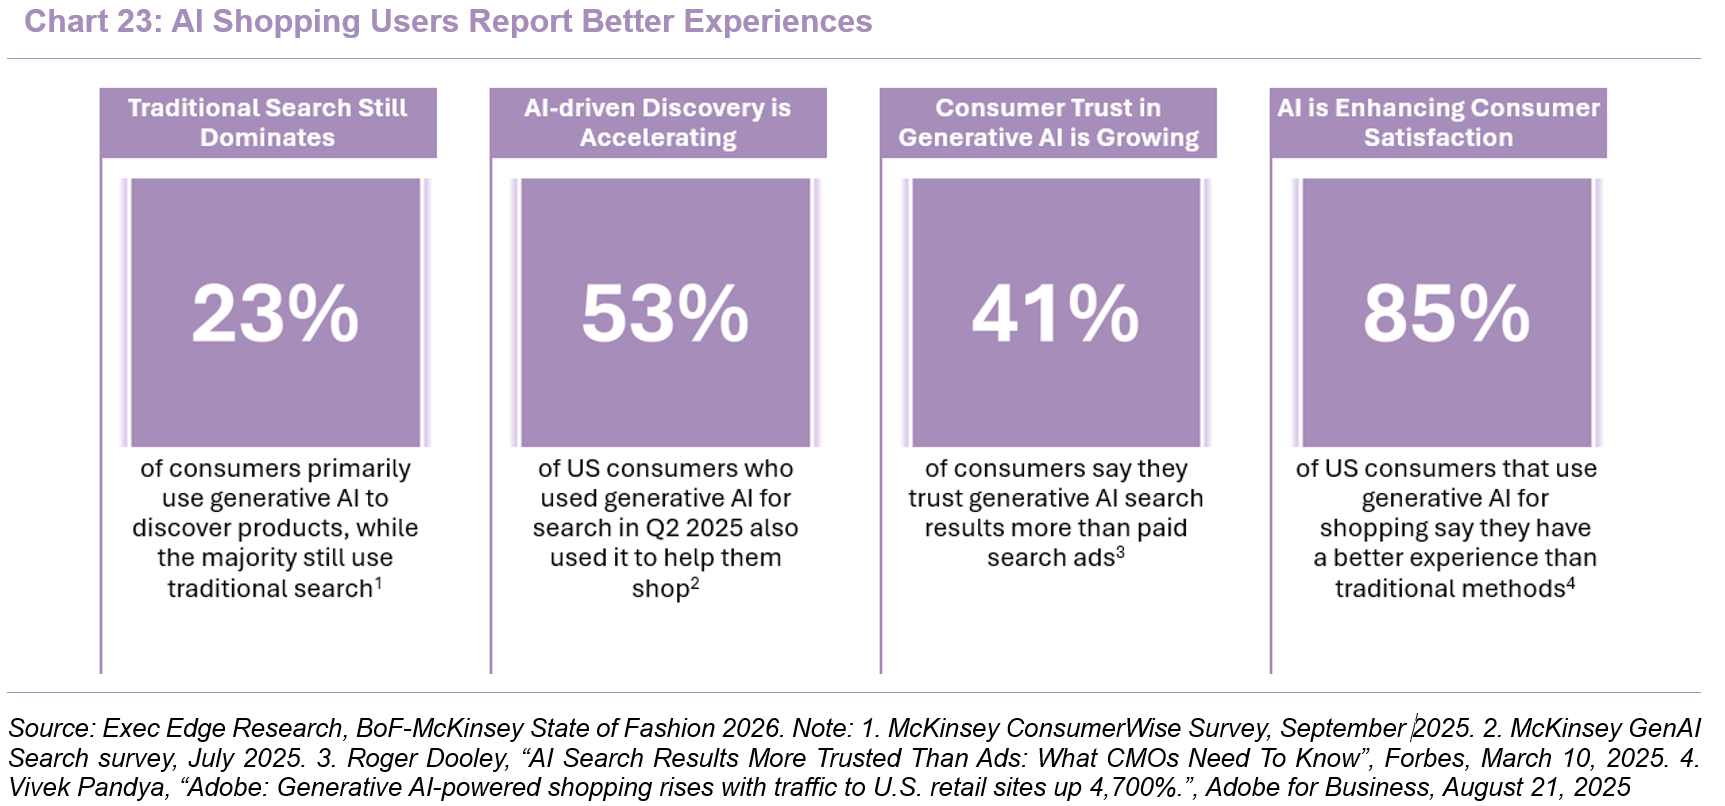
- AI is reshaping fashion discovery and conversion, but value creation will depend on proprietary data and operational integration. Adobe Digital Insights, drawing on more than one trillion visits, found that AI-referred traffic to U.S. retail websites increased 393% year over year through March 2026 and converted 42% better than non-AI traffic. The BoF-McKinsey State of Fashion 2026 similarly found that 53% of U.S. consumers using generative AI for search in 2Q25 also used it to shop, while shopping-related searches on generative-AI platforms increased 4,700% between July 2024 and July 2025. Fashion is well suited to assisted discovery because shoppers must navigate large assortments, subjective preferences and fit uncertainty. AI can narrow options, personalize recommendations, generate outfit combinations and connect customer intent with real-time product availability. Retailers can also apply predictive tools to segmentation, marketing allocation, demand forecasting and service automation, potentially improving conversion and acquisition efficiency.
- However, commercial adoption requires much more than adding a customer-facing chatbot. AI systems depend on structured product attributes, accurate inventory, usable imagery and reliable fit data before they can generate consistently relevant recommendations. Poor inputs can amplify inaccurate suggestions, returns and brand-damaging interactions, while privacy, governance and workflow redesign add implementation complexity. We expect AI readiness to become increasingly important to digital visibility and marketing productivity, with durable returns favoring retailers that combine proprietary customer insight with integrated product, inventory and fulfillment data.
- Product traceability is becoming an increasingly important link between regulatory compliance, digital product information and consumer trust. The European Commission has identified textiles as a priority product group for Digital Product Passports under the Ecodesign for Sustainable Products Regulation, with the passports intended to improve transparency across product value chains. The Commission launched the DPP Registry and testing environment in July 2026, although textile-specific requirements and implementation timelines remain subject to further rules. A functioning passport could connect each product with structured information on materials, origin, durability, care, repair and end-of-life handling, improving product-page clarity and supporting environmental claims, resale and recycling initiatives.
- The strategic value of traceability will depend on turning supplier and product data into reliable, usable information across the customer journey. Structured product information can make apparel catalogs easier for search engines and AI shopping agents to interpret, while helping retailers prepare for evolving traceability requirements. However, collecting reliable information across multi-tier supplier networks will require common identifiers, supplier-reporting standards and integration across product, inventory and e-commerce systems. Retailers that embed traceability within their core product-information architecture should be better positioned to adapt than those treating it as a standalone compliance exercise.
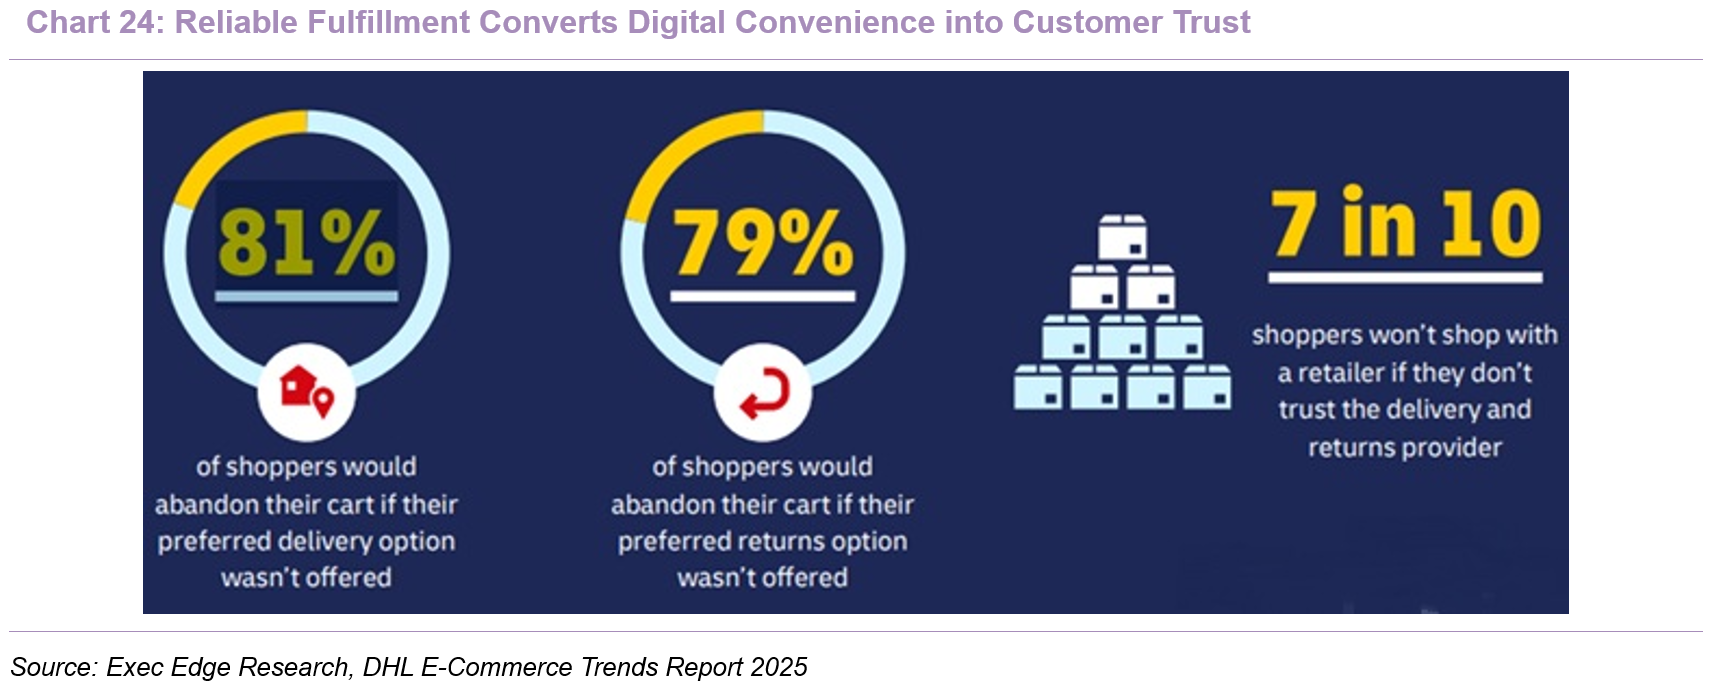
- Fulfillment has become a frontline driver of e-commerce conversion, trust and repeat purchasing. DHL’s 2025 E-Commerce Trends Report, based on 24,000 shoppers across 24 markets, found that 81% would abandon a purchase if their preferred delivery option was unavailable, 79% would leave when the returns process failed to meet expectations and 7 in 10 shoppers would not buy from a retailer they did not trust to handle delivery and returns. Meeting these expectations requires real-time inventory visibility, intelligent order routing and accurate delivery promises across websites, marketplaces and customer-service channels. Modern warehouse- and order-management systems can release orders continuously, prioritize time-sensitive demand and provide timely status updates, while predictive tools can position inventory closer to expected demand and flag potential delays. The strongest fulfillment models balance speed and flexibility with reliable execution and attractive unit economics. McKinsey’s U.S. delivery research indicates that shoppers value on-time reliability more than universal same-day service, making accurate promises and flexible options more important than maximum speed on every order. Retailers must therefore balance service levels against labor, freight, automation and inventory-duplication costs, while returns add further complexity through reverse-logistics and markdown risk. We believe leading operators will use technology to improve speed and reliability while tailoring delivery choices to customer urgency and order economics.
- LE’s digitally native model provides a strong foundation for technology-led growth, with execution determining the scale of the benefit. More than 95% of LE’s business is conducted online, and the company is deploying AI and advanced analytics to improve marketing precision, personalization and retention across DTC and B2B. The Manhattan warehouse-management system has moved distribution-center processing to real time, enabling same-day fulfillment, shortening standard delivery times by 20%-25% and expanding personalization capacity. The planned SAP implementation should build on this foundation by creating a more scalable operating backbone. These capabilities align LE with rising expectations for relevant discovery, accurate availability and faster delivery. The initial warehouse disruption nevertheless demonstrates that technology investments create value only when implementation is stable. We believe sustained fulfillment performance, more efficient customer acquisition and better integration of customer, product and inventory data could turn LE’s digital infrastructure into a durable growth and margin advantage.
Tariff Volatility Elevates Sourcing Costs and Margin Risk
- U. S. apparel importers face higher landed costs as new country-based tariffs compound an already elevated duty burden. The American Apparel and Footwear Association estimates that effective apparel and footwear tariffs already average more than five times the rate applied across other U.S. imports. Effective July 24, 2026, USTR imposed additional Section 301 duties on most imports from 60 trading partners, generally adding 10% for goods from Bangladesh, Cambodia, India, Indonesia and several other economies and 12.5% for most remaining covered countries, including China and Vietnam, subject to exemptions and special partner treatment. USTR also plans tariff-rate quotas for specified textiles and apparel from Bangladesh, Cambodia, Indonesia and Malaysia that use U.S. inputs; until those quotas are established, the applicable 10% duty remains. Because these measures generally sit on top of ordinary apparel duties, headline rates understate the full landed-cost burden. Changing exemptions, trade arrangements and enforcement decisions should therefore sustain sourcing, pricing and inventory-planning uncertainty.
- Tariff mitigation requires apparel brands to balance supplier concessions, sourcing shifts, pricing and inventory risk. Vendor negotiations, country diversification, assortment changes and selective price increases can reduce exposure, but each involves trade-offs. Supplier concessions may be difficult to sustain where factory margins are already narrow, while relocating production requires available capacity, compliant inputs, acceptable quality and manageable lead times. Passing costs through can weaken conversion in a value-sensitive market, whereas absorbing them protects price points at the expense of merchandise margin. Advance purchasing can defer the impact but increases working-capital requirements and markdown risk. Supply-chain flexibility, lower vendor concentration and negotiating leverage remain important defenses against tariff volatility, while the textile quota mechanism may also require stronger documentation of U.S. cotton or textile inputs. We expect sourcing diversification to become increasingly valuable, although it cannot eliminate the underlying trade-off among price competitiveness, margins and inventory discipline.
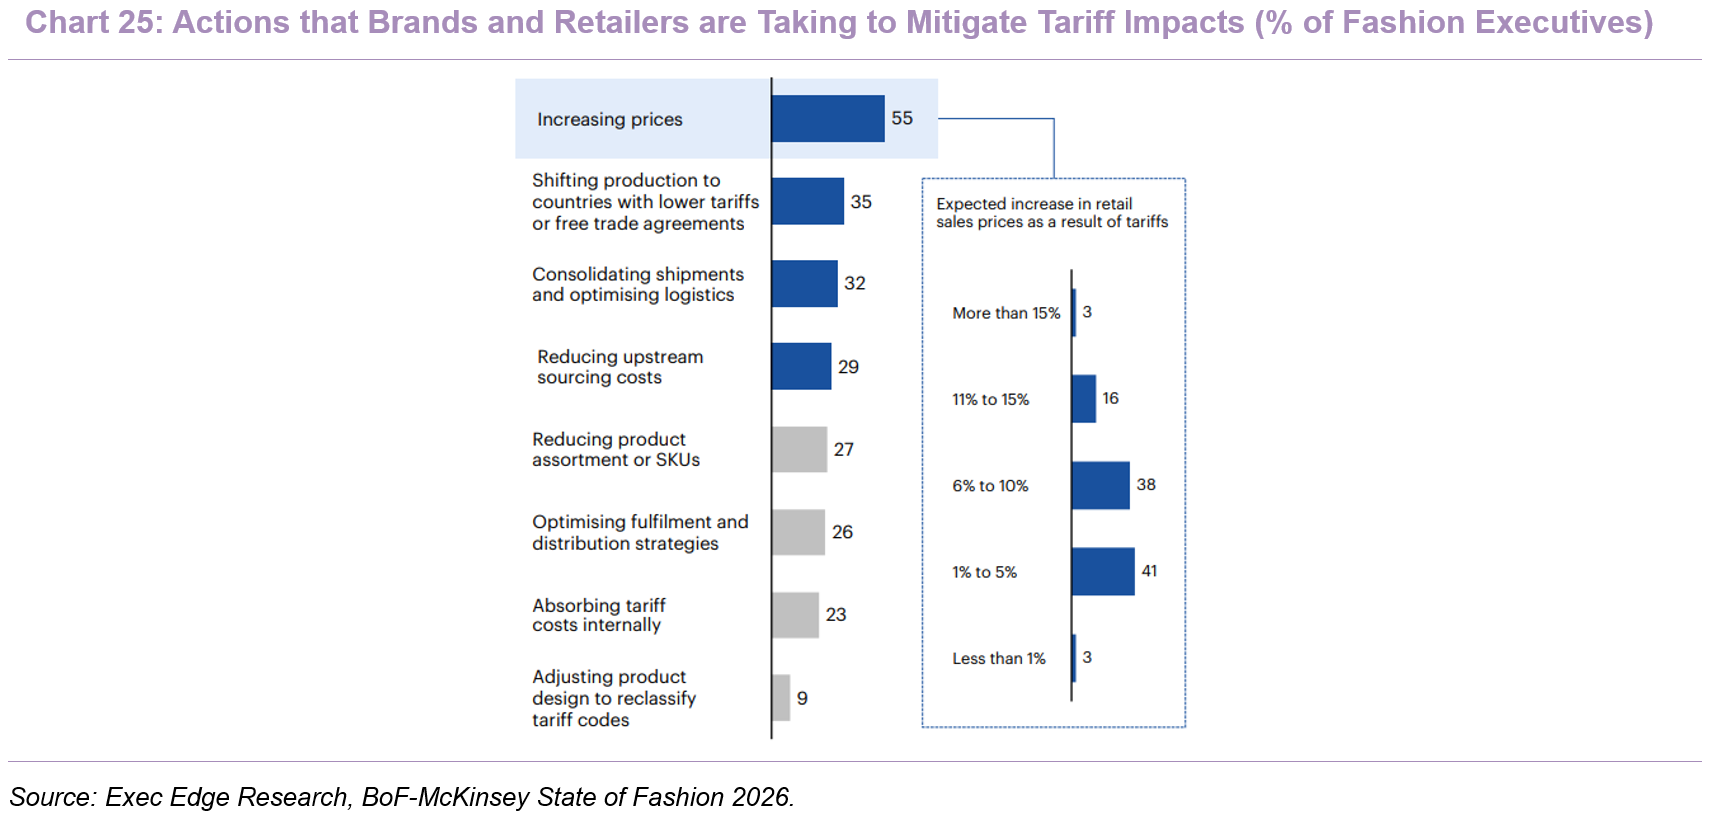
- LE’s diversified sourcing base and supplier relationships provide tariff-mitigation flexibility, but exposure remains material. Most merchandise is imported from Asia, with the five largest sourcing countries accounting for approximately 71% of FY25 purchases. Management’s FY26 outlook incorporated a prudent 15% tariff assumption, with vendors expected to absorb roughly half of the burden and the remainder shared between LE’s margins and customer pricing. Larger suppliers can shift production across countries, while assortment concentration and factory consolidation strengthen negotiating leverage. However, USTR’s July 24 action followed LE’s June guidance, and the ultimate impact will depend on sourcing mix, product classifications and available exemptions. Merchandise margin, pricing elasticity and average unit cost will therefore remain key indicators of LE’s ability to offset tariff pressure without weakening demand.
Management Team
Seasoned Leadership Team Strengthened by New CEO Charlie Cole
- LE’s leadership team combines digital-transformation expertise with continuity across finance, product, technology, marketing and Outfitters. LE is led by a deep and experienced management team that pairs long-tenured operators with proven external hires across merchandising, technology, marketing, finance and business operations. The team was strengthened in July 2026 with the appointment of Charlie Cole as Chief Executive Officer, succeeding Andrew McLean. Cole is a consumer-brand and digital-transformation executive with more than two decades of leadership across digital commerce, technology, artificial intelligence and omnichannel retail, having previously led FTD, Tribute Technology and XGen AI and held senior digital roles at TUMI and Samsonite. He is supported by Bernard McCracken in finance, Kym Maas in product and creative, Martin Christopher in technology, John DeFalco in Outfitters, Sarah Sylvester in marketing and Andy Houghton in Europe, aligning the leadership bench with LE’s principal strategic and execution priorities. The team now enters the next phase focused on post-JV execution, customer growth, technology implementation and operating discipline.

Fundamentals & Valuation
Balance-Sheet Reset Creates a Clearer Path to Earnings Recovery
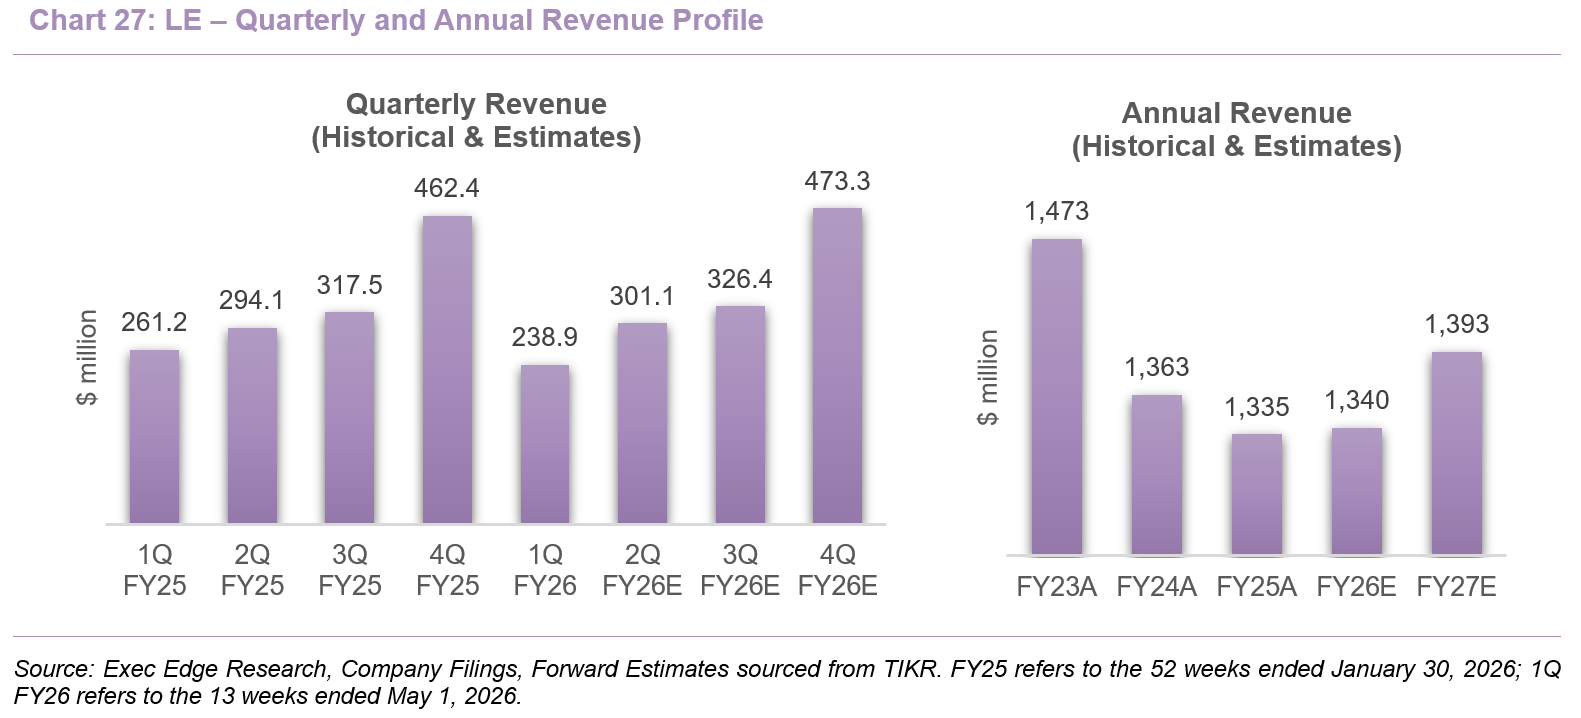
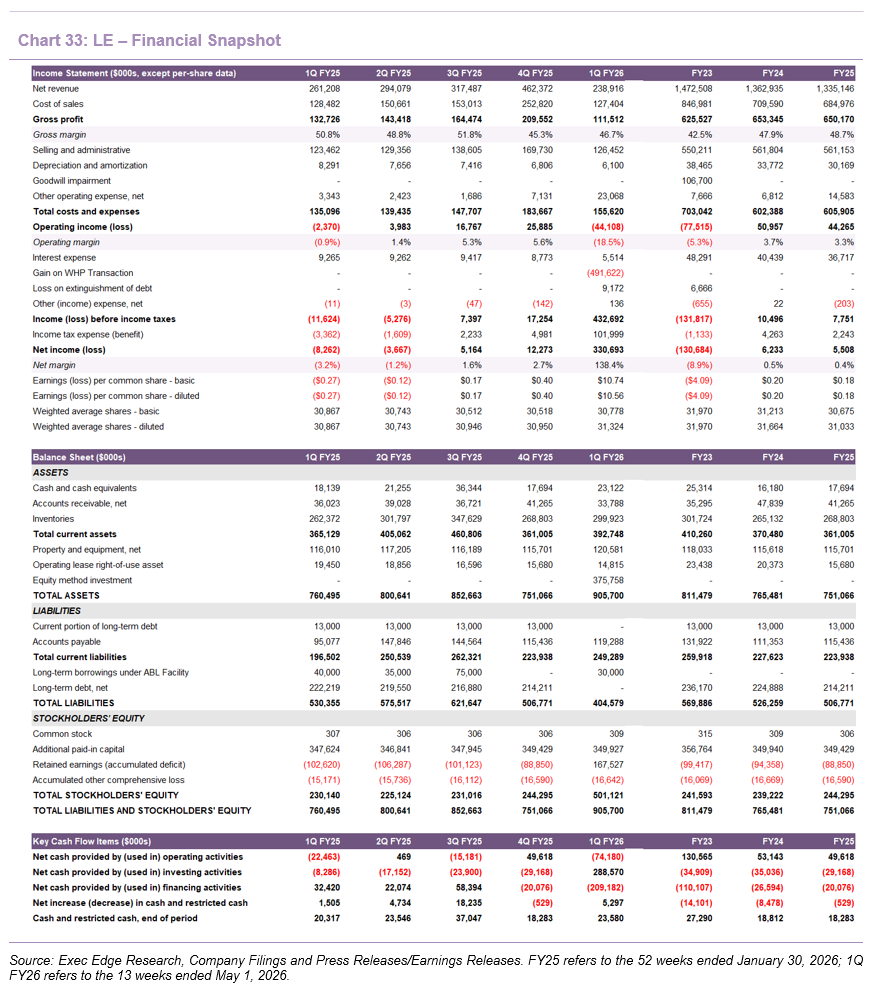
- Revenue is expected to recover from the 1Q FY26 fulfillment disruption, with positive growth anticipated through the remainder of FY26. LE’s revenue declined 8.5% year over year to $238.9 million in 1Q FY26 as the warehouse-management-system rollout delayed shipments, with U.S. eCommerce and Outfitters each declining approximately 10%. Management estimated that revenue would otherwise have increased at a low-single-digit rate, supported by 14.5% growth in Europe, which was unaffected by the disruption. Positive comparable sales through and beyond Memorial Day, led by swim, totes and men’s, provided an early indication that fulfillment and demand trends were normalizing. Management guided 2Q FY26 revenue to $290-$310 million and FY26 revenue to $1.30-$1.40 billion, while Street estimates sourced from TIKR sit near the respective midpoints at $301.1 million and $1.34 billion. The estimates imply a return to 2%-3% year-over-year quarterly growth from 2Q FY26 onward, resulting in broadly flat annual revenue in FY26 before an approximately 4% increase to $1.39 billion in FY27. Beyond FY26, management is targeting mid-single-digit annual growth over the next three years, driven by DTC and Outfitters, customer acquisition, product franchises and B2B expansion.
- The post-JV royalty structure establishes a lower gross-margin base, while fulfillment normalization and tariff mitigation should support gradual improvement. Gross profit declined 16.0% to $111.5 million in 1Q FY26, with gross margin contracting 4.1 ppts to 46.7% due to distribution-center deleverage, the new royalty structure and tariffs, partly offset by healthy underlying merchandise margin. Although reported FY25 gross margin improved 0.8 ppts to 48.7%, the company’s pro-forma recast establishes approximately 43% as the more relevant post-JV baseline and starting point for annual improvement. FY26 guidance incorporates tariffs at currently implemented rates, with management expecting vendors to absorb approximately half of the burden and the remainder to be addressed through LE’s margins and customer pricing. We expect the pace of gross-margin recovery to depend on fulfillment normalization, merchandise-margin improvement and tariff mitigation more than offsetting the continuing royalty expense.
- LE’s segment mix indicates that the 1Q FY26 disruption was concentrated in fulfillment-affected U.S. channels rather than broad-based across the portfolio. U.S. eCommerce remains nearly two-thirds of revenue, so the warehouse-management rollout disproportionately affected consolidated sales. However, digital traffic increased at a mid-teens rate, women’s apparel and swim posted positive comps, and management expects positive eCommerce comps in 2Q FY26. Outfitters remained the second-largest channel, where reported weakness masked strength in national and airline accounts and school orders affected by promotional timing. Europe provided a cleaner demand signal, with revenue growing 15% as franchise-led assortments and localized marketing supported relevance and inventory efficiency. Third Party revenue declined partly by design as LE reduced promotion-led volume to protect brand positioning and margin quality, while Amazon remained solid and Nordstrom generated stronger full-price selling. Licensing is now a smaller reported revenue component because trademark royalties moved into the JV, with LE’s 50% profit participation instead reflected in adjusted EBITDA. The segment trends support the case for recovery, although sustained growth will still depend on stable fulfillment and continued demand conversion.
- Operating leverage should improve after the disruption-heavy first quarter, although restructuring and technology investment will remain visible through FY26. LE’s elevated 1Q FY26 cost ratios largely reflected revenue deleverage and restructuring rather than a broad increase in recurring operating costs. SG&A increased 2.4% year over year to $126.5 million and expanded 5.7 ppts to 53.0% of revenue, as delayed shipments reduced expense absorption while digital-marketing investment continued. Other operating expense rose to $23.1 million from $3.3 million, primarily reflecting corporate restructuring and strategic-alternative costs, contributing to a $44.1 million operating loss versus $2.4 million in 1Q FY25. Management has not provided specific SG&A or operating-income guidance, but fulfillment normalization and renewed revenue growth should improve fixed-cost absorption over the balance of the year. Continued spending on SAP, marketing and other transformation initiatives may moderate the pace of recovery, while JV-related accounting makes adjusted EBITDA a more useful measure of underlying operating progress.
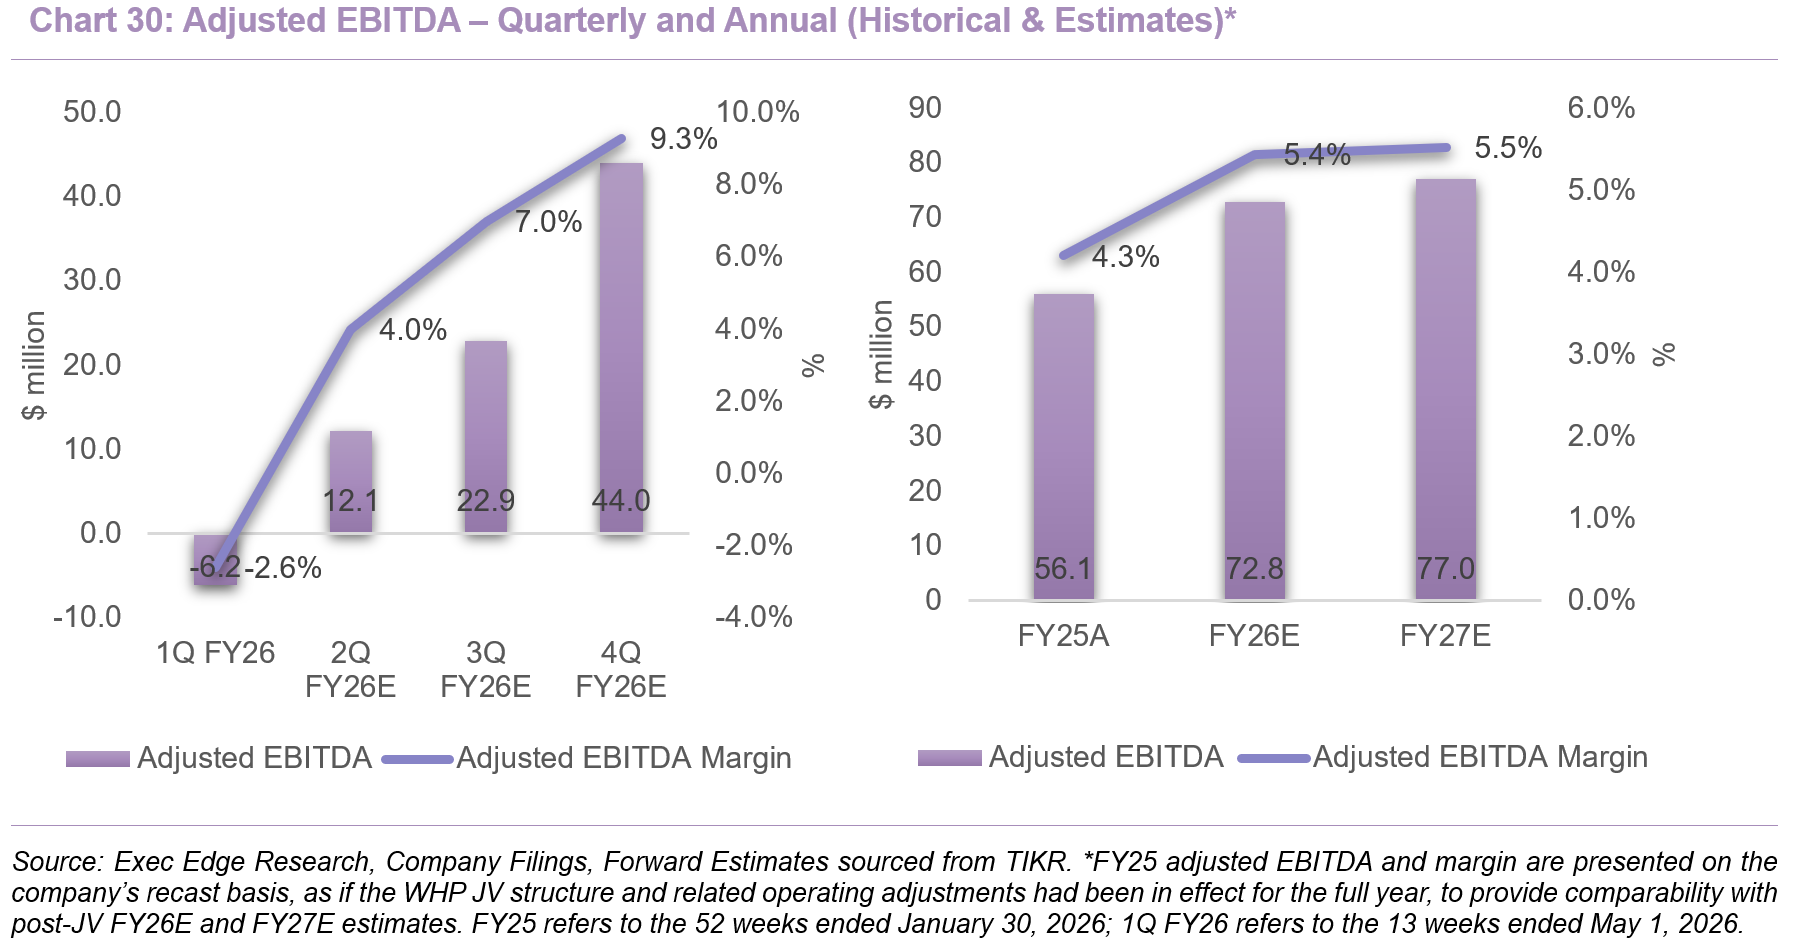
- Adjusted EBITDA is expected to rebound sharply from the weak first quarter, although the scale and recurrence of adjustments remain important to earnings quality. LE’s 1Q FY26 adjusted EBITDA declined to negative $6.2 million, or negative 2.6% of revenue, from positive $9.5 million, or 3.6%, in 1Q FY25. The reconciliation included substantial restructuring, tariff and JV-related adjustments, yet adjusted EBITDA still deteriorated by $15.8 million year over year as delayed shipments, distribution deleverage, the new royalty structure and tariffs pressured profitability. Historical comparison also requires the JV recast: FY25 reported adjusted EBITDA was $102.3 million at a 7.7% margin, but the comparable post-JV baseline is $56.1 million, or approximately 4.3% of revenue.
- The post-JV earnings base creates a clear path to EBITDA recovery, with margin expansion expected to build through FY26 and continue into FY27. Management guided 2Q FY26 adjusted EBITDA to $11-$14 million and FY26 adjusted EBITDA to $68-$78 million, while Street estimates sourced from TIKR sit near the respective midpoints at $12.1 million and $72.8 million. The annual guidance implies approximately 21%-39% growth from the recast FY25 base. Street estimates also indicate sequential margin expansion through the remainder of FY26, supported by fulfillment normalization, seasonal leverage, merchandise-margin improvement and a larger JV profit contribution. For FY27, Street estimates imply adjusted EBITDA of $77.0 million, representing 5.8% year-over-year growth and a 5.5% margin. Management is targeting a high-single-digit adjusted EBITDA margin over time, although sustained progress will require operating improvement to become increasingly visible before restructuring and other adjustments.
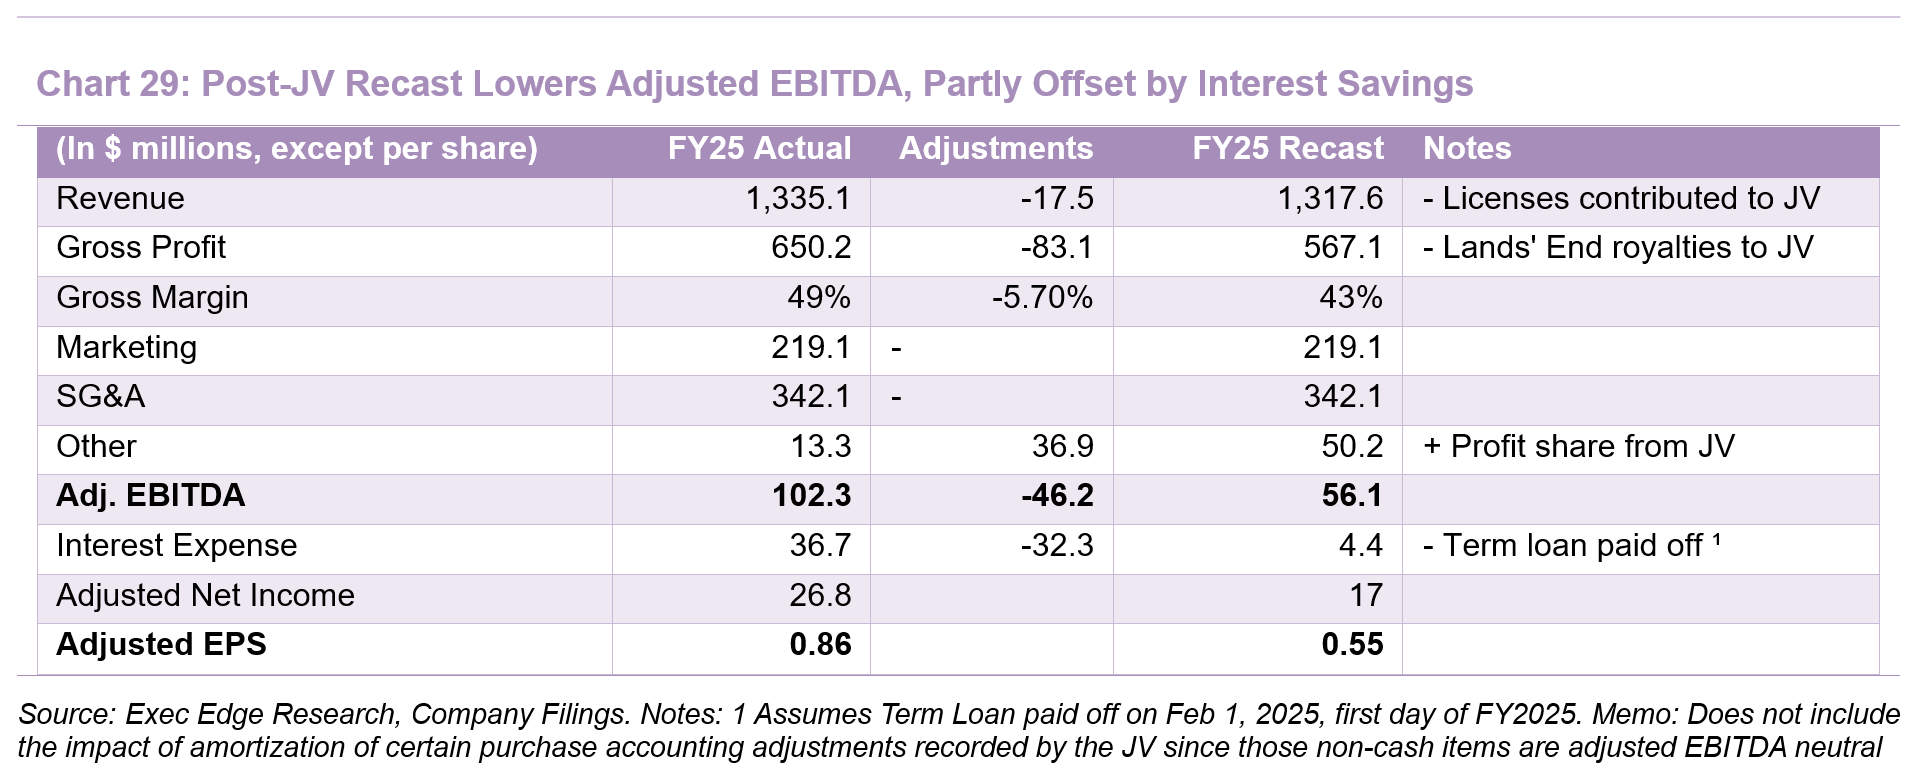
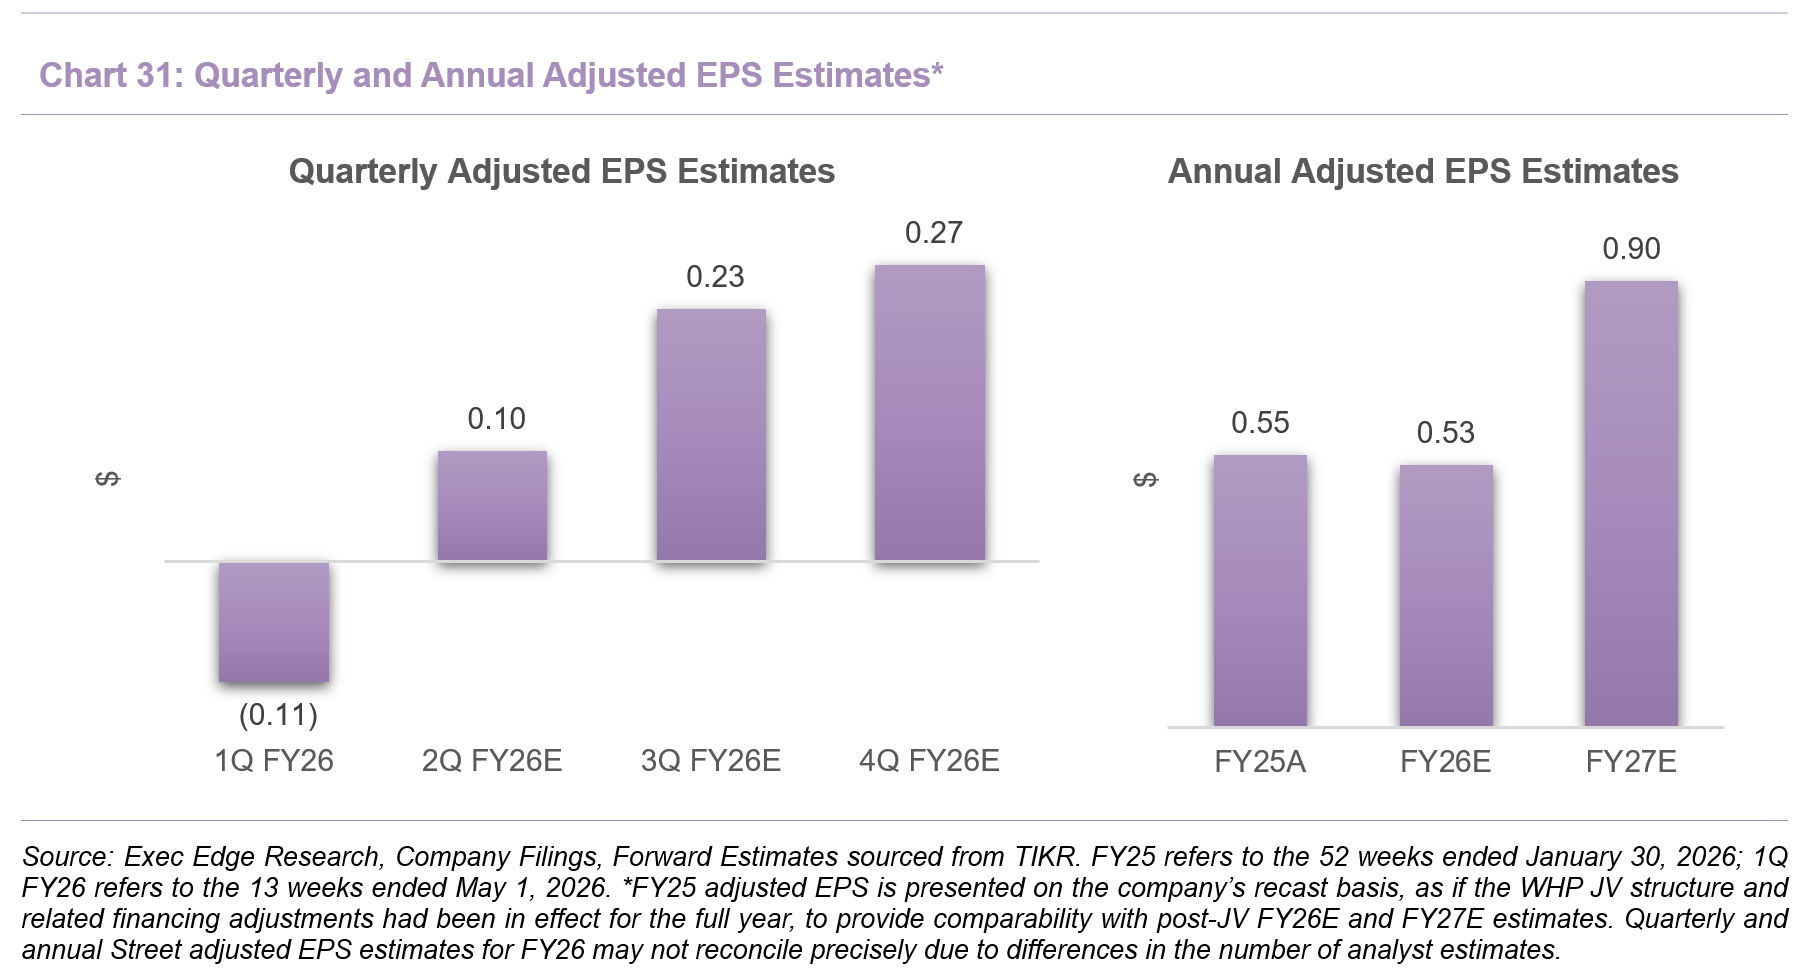
- Lower interest expense is supporting adjusted EPS even before operating profitability fully recovers, while GAAP earnings remain distorted by the JV transaction. LE reported 1Q FY26 GAAP net income of $330.7 million, or $10.56 per diluted share, primarily reflecting the $491.6 million transaction gain. Adjusted results provide a more useful view of recurring performance: the adjusted net loss narrowed to $3.5 million, or $0.11 per share, from $5.4 million, or $0.18 per share, in 1Q FY25 despite weaker adjusted EBITDA. The improvement primarily reflected interest expense declining to $5.5 million from $9.3 million following repayment of the term loan.
- Adjusted EPS is expected to turn positive in 2Q FY26 and build through the remainder of the year as operating performance normalizes and the lower interest burden supports earnings conversion. LE guided 2Q FY26 adjusted EPS to $0.06-$0.16 and FY26 adjusted EPS to $0.32-$0.65, while Street estimates sourced from TIKR sit at $0.10 and $0.53, respectively. Street estimates imply sequential EPS of $0.23 in 3Q FY26 and $0.27 in 4Q FY26, followed by $0.90 in FY27. The FY26 estimate of $0.53 is broadly consistent with the $0.55 recast FY25 baseline despite the first-quarter disruption, while FY27 implies a more meaningful benefit from operating recovery and lower financing costs.
- The WHP transaction substantially reduced financial risk and refinancing exposure. Cash and cash equivalents were $23.1 million at May 1, 2026, while borrowings consisted of $30.0 million under the ABL and no term debt following the use of $234.0 million of transaction proceeds for repayment. Calculated net debt therefore fell to approximately $6.9 million from $209.5 million at FY25-end. Using the $56.1 million recast FY25 adjusted EBITDA baseline, indicative post-transaction net leverage is approximately 0.1x, compared with approximately 2.0x before the transaction using reported FY25 adjusted EBITDA. The economic benefit is also visible in pro-forma annual interest expense, which declines to $4.4 million from $36.7 million, supporting adjusted EPS conversion and materially reducing refinancing risk.
- Balance-sheet flexibility has improved, although seasonal working-capital needs and fixed royalty obligations still constrain deployable liquidity. LE retained $104.2 million of ABL availability, providing a buffer for seasonal inventory investment, while stockholders’ equity increased to $501.1 million from $244.3 million at FY25-end, largely reflecting the transaction gain. The JV investment recorded on the balance sheet is not equivalent to immediately deployable cash, and LE’s $50 million annual minimum royalty remains a significant operating fixed charge. Accordingly, the transaction materially improves liquidity flexibility without eliminating the company’s fixed cash commitments.
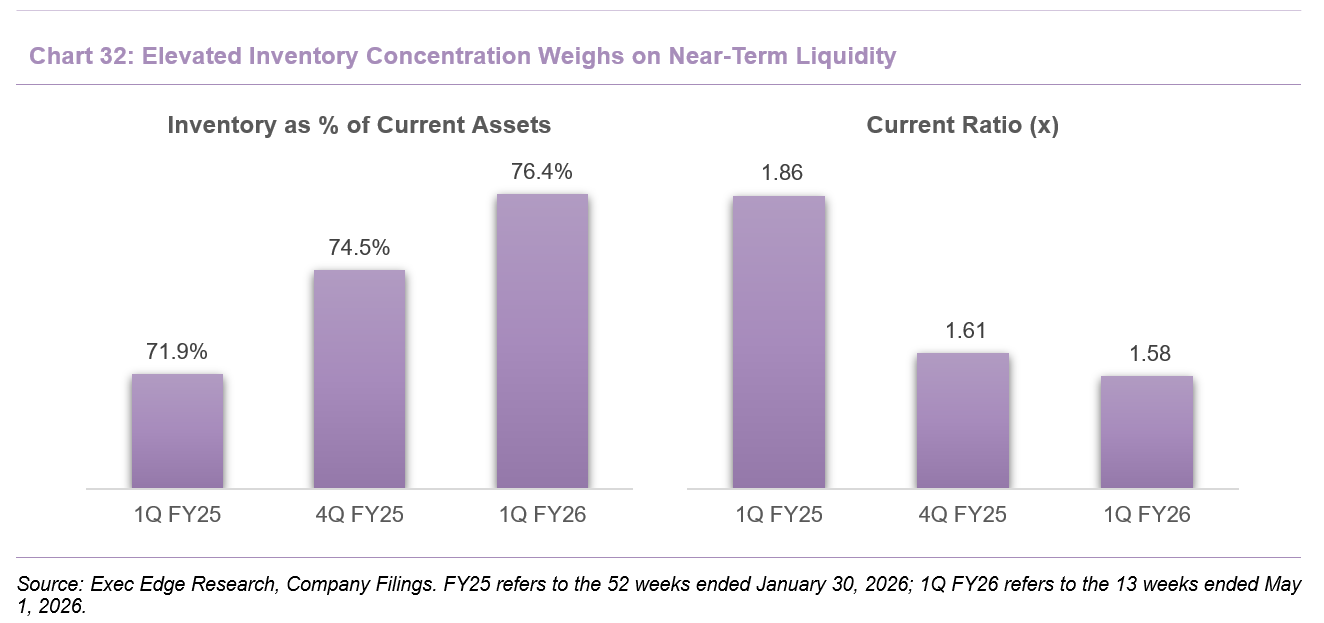
- Elevated inventory and seasonal investment are delaying cash conversion despite the stronger post-transaction balance sheet. Inventory reached $299.9 million at May 1, 2026, increasing 14.3% year over year and 11.6% from FY25-end, as distribution-center timing, tariff-related product costs and normalized purchasing contributed to the build. Inventory absorbed $31.5 million of operating cash in 1Q FY26, compared with a $4.1 million source a year earlier, contributing to operating cash outflow of $74.2 million and free cash flow of negative $84.4 million. Although improved warehouse processing should support inventory flow, conversion into cash will depend on demand absorbing the elevated merchandise without materially higher markdowns. The position should also be viewed within LE’s normal seasonal cycle, as working capital typically builds through the second and third quarters before releasing during the holiday-weighted fourth quarter.
- Cash normalization will be important to funding reinvestment and capital returns. Management describes DTC and Outfitters as LE’s cash-flow engine and expects approximately $40 million of FY26 capital expenditure, primarily for SAP and warehouse-system investments. Prospective maintenance spending is expected to decline to $20 million or less annually after SAP implementation, which should improve longer-term cash conversion. LE also authorized a $100 million share-repurchase program, but only approximately $0.3 million was deployed in 1Q FY26, leaving approximately $99.7 million available. We expect repurchase activity to remain selective until inventory, seasonal cash generation and the remaining SAP investment requirements become clearer.
- Overall, LE now has a materially stronger financial foundation, and the investment case depends on converting the balance-sheet reset into sustained earnings growth. The WHP transaction has sharply reduced leverage and interest expense, while FY26 guidance and Street estimates imply adjusted EBITDA growth and margin expansion from the comparable post-JV FY25 base. We believe the key question is whether fulfillment normalization, merchandise-margin improvement, tariff mitigation, and a growing JV profit contribution can lift profitability toward management’s longer-term targets. Elevated inventory, ongoing SAP investment, and the fixed royalty obligation temper near-term cash flexibility, but successful execution would leave LE with a debt-light operating platform, improving earnings conversion and retained exposure to capital-light licensing upside.
Margin Recovery and JV Monetization Define LE’s Valuation Upside
- Disclaimer: Exec Edge does not publish proprietary estimates, ratings, price targets or investment recommendations. The valuation discussion below is illustrative only, based on company-disclosed outlook metrics and third-party data; it is not a recommendation, price target, rating or prediction of future pricing.
- We believe LE’s re-rating potential rests on demonstrating that the post-JV model can deliver a more profitable, less leveraged, and increasingly capital-light earnings profile. The current valuation reflects uncertainty around the structural royalty burden, the 1Q FY26 fulfillment disruption, and the pace at which the WHP JV can contribute meaningful profits. Investor confidence should improve as LE shows that the disruption was temporary, returns DTC and Outfitters to sustained growth, and expands adjusted EBITDA margins. Additional licensing agreements and rising JV distributions would demonstrate that LE can participate in global brand monetization without funding incremental inventory or operating infrastructure, while lower interest expense should support stronger adjusted earnings conversion. Inventory normalization, improved cash generation and disciplined capital allocation would further reinforce the balance-sheet reset. Together, these milestones could position LE as a debt-light operating platform with recurring licensing participation and improving earnings quality.
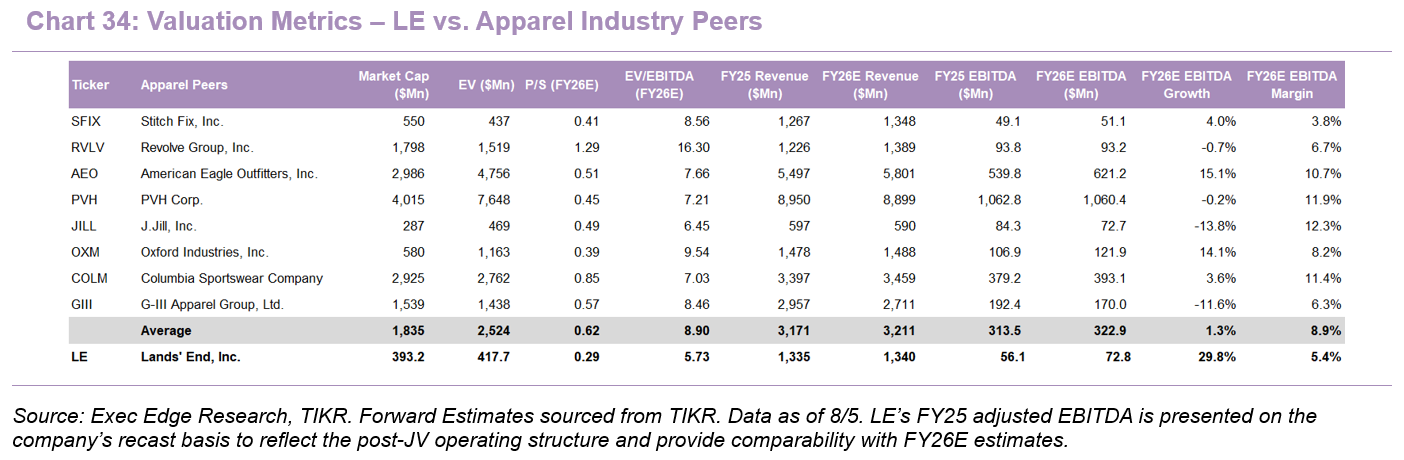
- LE’s discount to apparel peers provides an illustrative framework for assessing post-JV value. The framework values LE as an integrated post-JV business comprising DTC, Outfitters, and its retained 50% JV interest, while assigning no separate value to the potential exchange into WHP equity. We assess LE using FY26E EV/adjusted EBITDA and P/S multiples derived from selected publicly traded apparel and digitally oriented retail peers. The peer group trades at average multiples of 8.90x FY26E EBITDA and 0.62x FY26E revenue, versus 5.73x and 0.29x for LE, highlighting the discount currently assigned to its execution risk and post-JV transition. Applying peer averages to Street estimates of $72.8 million of adjusted EBITDA and $1.34 billion of revenue produces a broad illustrative valuation range for LE’s post-JV profile.
- On an EV/EBITDA basis, LE’s current stage of earnings recovery supports an illustrative equity value of ~$624 million, or $20.32 per share. Applying the peer average of approximately 8.90x to LE’s FY26E adjusted EBITDA generates enterprise value of ~$648 million. After deducting lease-adjusted net debt, we arrive at equity value of ~$624 million, or $20.32 per share. This framework captures LE’s expected EBITDA growth from the $56.1 million recast FY25 base, while leaving room for further re-rating as margins move closer to management’s high-single-digit objective.
- On a P/S basis, LE’s revenue scale and margin-normalization potential imply illustrative equity value of ~$830 million, or $27.04 per share. Applying the peer P/S multiple to FY26E revenue of $1.34 billion implies equity value of ~$830 million, or $27.04 per share. This approach captures LE’s revenue scale during the margin-normalization phase, with further upside dependent on translating that scale into stronger profitability, cash conversion and JV contributions.
- Execution across fulfillment, margins, JV distributions, and cash conversion will determine whether LE can close that discount. Evidence that fulfillment has normalized, adjusted EBITDA margins are expanding, and JV distributions are becoming a more visible contributor would improve confidence in the durability and quality of earnings. Combined with lower leverage, reduced interest expense and better cash conversion, that progression could support a valuation closer to peer levels over time.
Risks
- Consumer demand and macroeconomic conditions. LE sells discretionary apparel and home products, leaving revenue exposed to inflation, interest rates, employment, consumer confidence and household purchasing power. A weaker spending environment can reduce order frequency, push customers toward lower-priced alternatives and increase promotional intensity. Lower demand may slow inventory turns, raise markdowns and compress gross margin, while the post-JV minimum royalty creates a fixed operating burden. Consumer demand, promotional activity and inventory turns will therefore remain important indicators of earnings and cash-flow resilience.
- Brand relevance and competitive positioning. LE depends on keeping its product assortment, fit, quality and marketing relevant as apparel preferences and digital discovery habits change. Failure to refresh franchises, attract younger customers or deliver products on time could weaken traffic and conversion. Competition from department stores, specialty retailers and online apparel platforms may also require higher marketing spend, price reductions or promotions. Because Lands’ End merchandise accounts for substantially all revenue, continued product innovation, customer acquisition and full-price demand are central to sustaining brand relevance.
- Dependence on the WHP operating license. LE now operates substantially all branded activities under a long-term license from the WHP-controlled JV. The agreement requires annual minimum royalties of $50 million through contract year 11, with scheduled increases thereafter, regardless of whether sales support that burden. Failure to meet required royalty obligations could permit termination after applicable cure periods. Although the agreement automatically renews for up to twelve additional seven-year terms and termination rights are principally tied to uncured payment defaults, the fixed minimum royalty may pressure margins and liquidity during periods of weaker sales.
- JV licensing and monetization execution. LE’s post-transaction value proposition depends partly on the WHP-controlled JV expanding licensing and monetizing the contributed brand intellectual property. New licenses may develop more slowly, generate lower economics or damage brand positioning if partners miss quality standards. LE also lacks control over whether a qualifying WHP monetization event occurs, or the terms of any exchange of its JV interest. The pace and quality of new licensing agreements, JV profit distributions and any future monetization event will therefore influence how much incremental value the structure ultimately creates.
- Global sourcing and supply-chain exposure. LE relies on independent manufacturers, largely outside the U.S., and a concentrated vendor base to source merchandise well before demand is known. Tariffs, freight disruption, port congestion, raw-material inflation, geopolitical conflict or vendor failures can raise landed costs and delay product availability. LE may be unable to offset those pressures through vendor negotiations, sourcing shifts or customer pricing without affecting demand. Tariff mitigation, vendor diversification and product availability will be key determinants of gross-margin performance and seasonal execution.
- Inventory planning and seasonality. LE must commit inventory before peak back-to-school and holiday periods, making forecast accuracy central to revenue, gross margin and cash conversion. Overestimating demand can raise carrying costs, working-capital needs and markdowns, while underestimating demand can create stockouts and lost sales. The risk is heightened by style, color and size complexity across owned websites, marketplaces and distribution locations. Inventory turns, markdown activity and seasonal working-capital conversion will therefore be important measures of execution.
- Technology implementation and cybersecurity. LE depends on interconnected eCommerce, warehouse, inventory, finance and customer-data systems, while continuing major platform upgrades, including SAP. Implementation failures or service interruptions can delay fulfillment, reduce efficiency and require additional capital, as the 1Q FY26 warehouse disruption demonstrated. Cyberattacks, third-party cloud outages or privacy breaches could also interrupt sales, expose customer and employee data, trigger regulatory penalties and damage trust. Stable warehouse execution, successful SAP implementation and continued protection of customer and corporate data are central to realizing the expected benefits of LE’s technology investments.
- Concentrated ownership and limited trading liquidity. LE’s ownership remains concentrated, giving principal stockholders substantial influence over director elections, change-of-control decisions and other matters requiring shareholder approval. Those interests may diverge from those of minority investors, reducing their ability to influence governance or strategic outcomes. A material sale or announced sale by a major holder could also pressure LE’s share price, particularly given the company’s limited public float. The ownership structure may therefore affect governance influence and share-trading liquidity independently of operating performance.
Subscribe to our Weekly Newsletter to Receive All Research
Contact: