

Download the Complete Report Here
 Lands’ End, Inc. (LE)
Fulfilment Normalizes as New CEO Sets Growth Agenda; Customer Acquisition Gains Momentum
- Key Takeaways:
- New CEO Charlie Cole is sharpening the growth agenda around digital execution, AI-enabled customer engagement and stronger operating infrastructure.
- 2Q revenue increased 2.7% y/y as fulfilment normalized; U.S. eCommerce growth included shipment catch-up and remains approximately flat YTD.
- New-to-file customers grew double digits, social traffic rose over 30%, and franchise strength in totes and swim is supporting customer acquisition.
- WHP JV generated $8.5 million of 2Q net earnings, while lower interest expense and licensing economics are increasingly shaping the post-JV earnings profile.
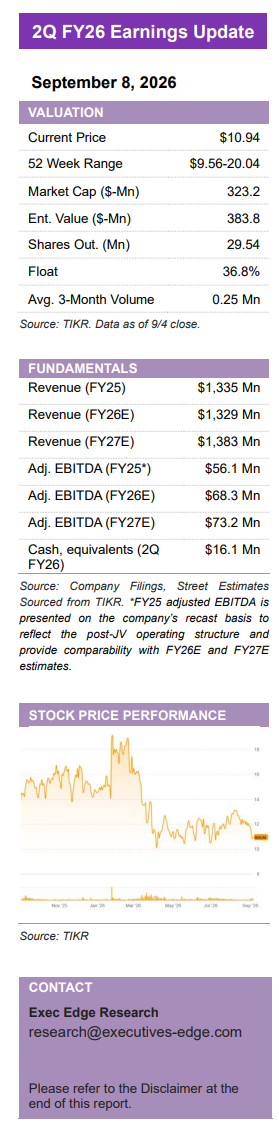
- LE trades at 5.62x FY26E EV/EBITDA versus 7.60x for peers, leaving rerating potential as margins, cash conversion and JV monetization improve.
- New CEO Charlie Cole used his first earnings call to sharpen LE’s growth agenda around customer engagement, digital execution and operating infrastructure, building on the existing franchise-led strategy. Cole joined in July and emphasized that the strategic direction remains intact, with the immediate priority on improving execution across fulfilment, technology and customer acquisition ahead of the holiday season. With more than 95% of the business conducted online, the opportunity is increasingly to improve how LE reaches, engages and converts customers while leveraging its existing brand, product franchises and first-party customer data more effectively. The agenda is therefore evolutionary rather than a strategic reset, but it establishes a clearer execution framework around customer experience, digital capabilities and more scalable growth.
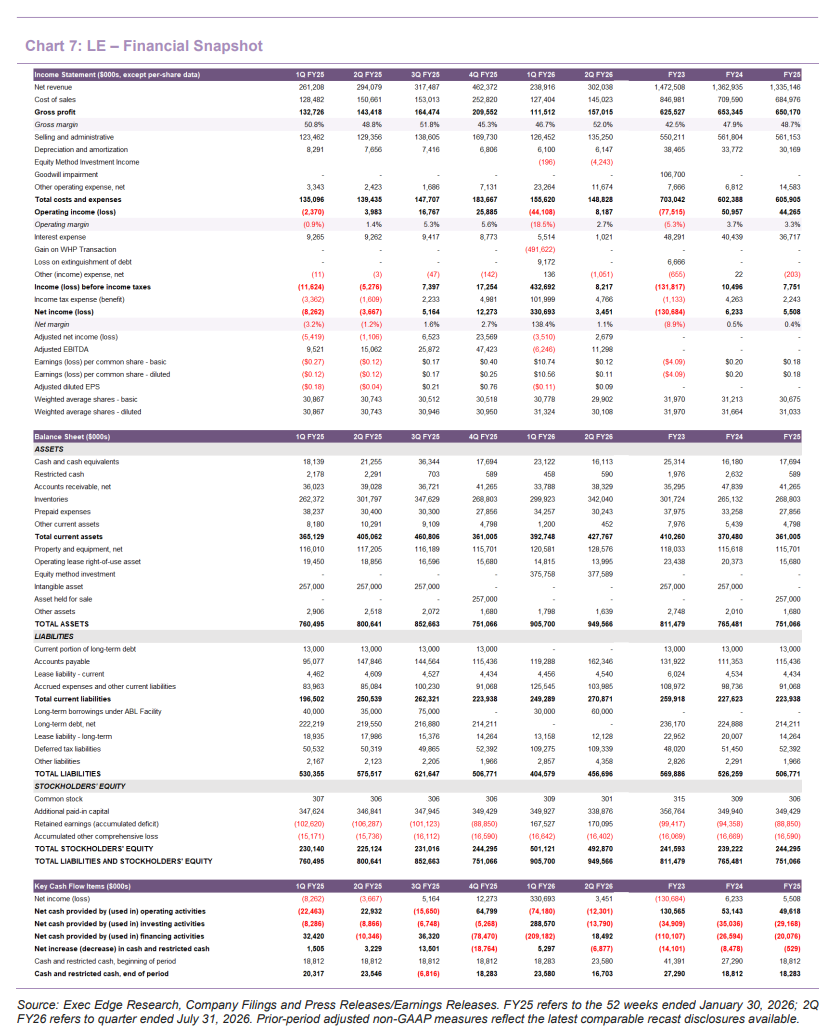
- 2Q FY26 marked meaningful progress beyond the first-quarter fulfilment disruption, with revenue returning to growth and core U.S. eCommerce operations normalizing. Revenue increased 2.7% y/y to $302.0 million from $294.1 million, above the mid-point of guidance of $290-$310 million, while U.S. Digital revenue increased 5.3% to $268.9 million. U.S. eCommerce revenue increased 9.0% to $182.4 million, Outfitters grew 4.4% to $69.3 million and Europe increased 0.5% to $19.7 million, partially offset by a 20.4% decline in Third Party revenue to $17.2 million. Adjusted net income improved to $2.7 million, or $0.09 per share, from an adjusted loss of $1.1 million, or $0.04 per share, while adjusted EBITDA declined 25.2% y/y to $11.3 million from $15.1 million and margin compressed to 3.7% from 5.1%. We believe the quarter provides meaningful evidence that the core U.S. operational disruption is receding, shifting the investment focus toward demand conversion, post-JV margin recovery and cash generation.
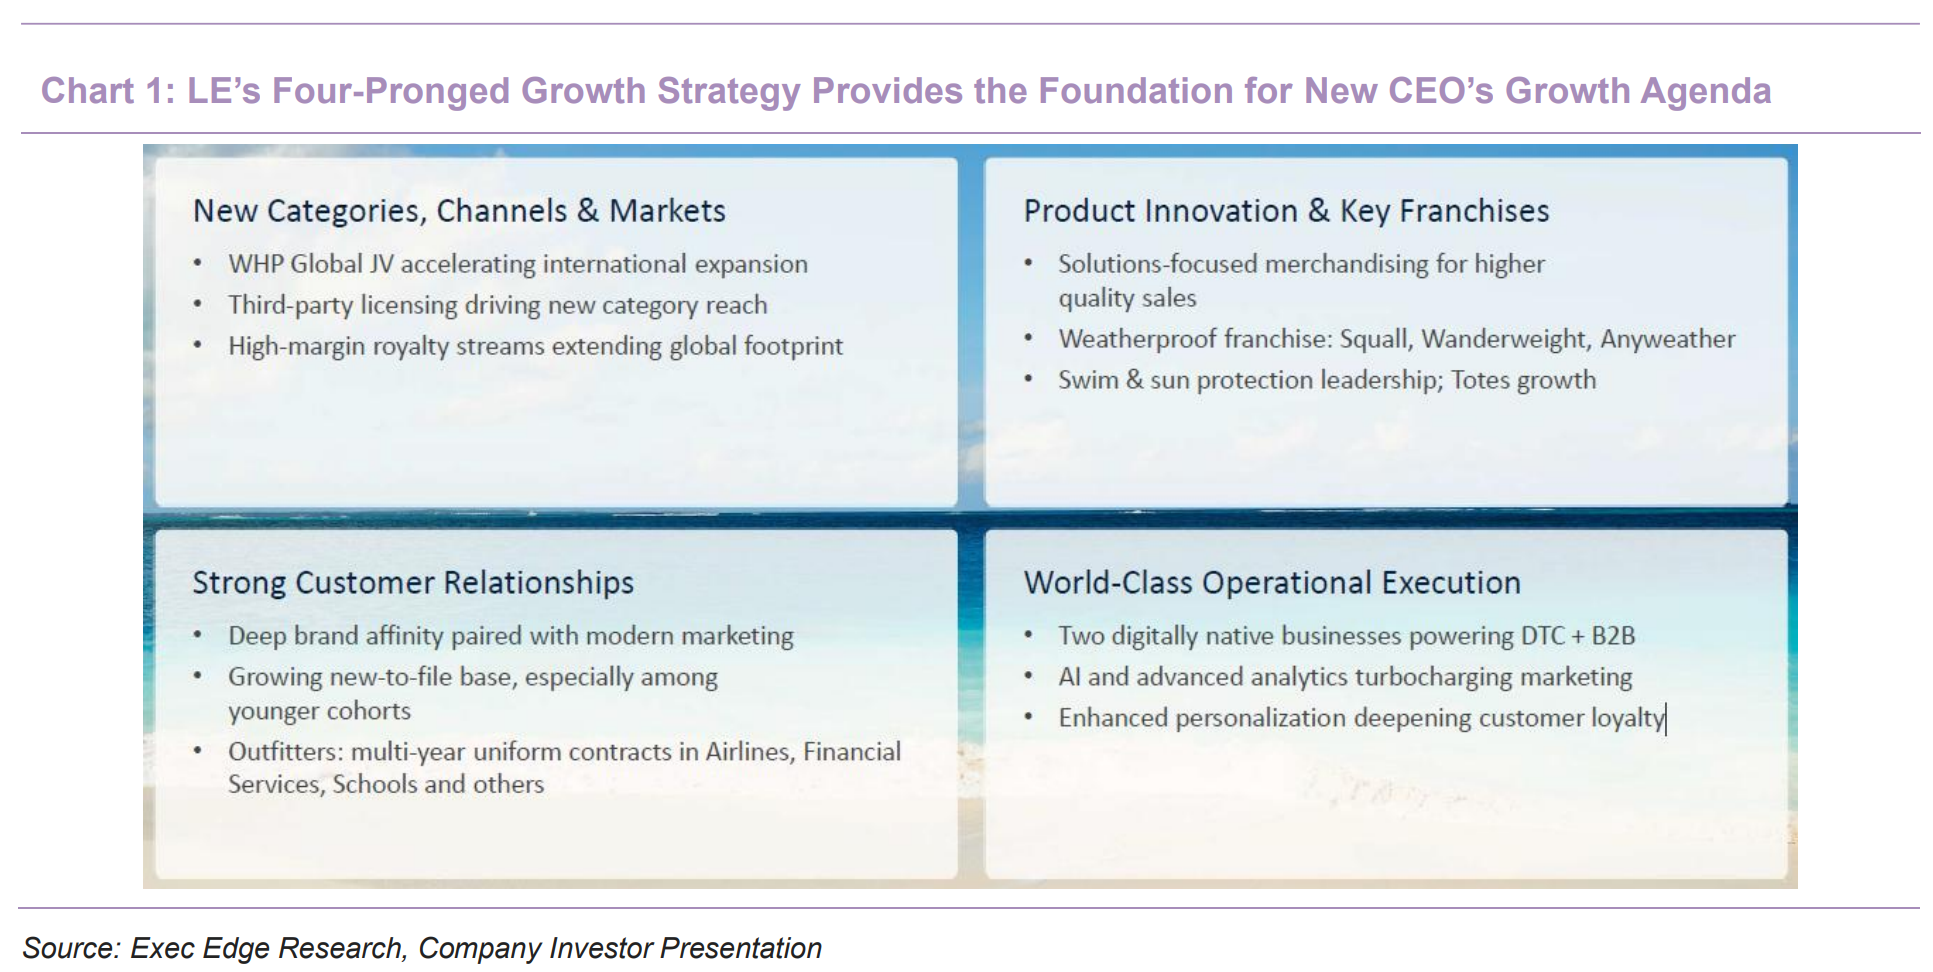
- Product franchises are becoming increasingly important customer-acquisition vehicles, with totes and swim supporting both near-term demand and broader demographic reach. Women’s and men’s apparel, particularly knits, performed well during the quarter, while U.S. eCommerce swim revenue increased at a high-single-digit rate and bags, led by the iconic five-pocket tote, remained a meaningful growth contributor. Totes and swim drove much of the double-digit increase in new-to-file customers, while personalization and embroidery add higher-value services around the tote franchise. The Wawa collaboration generated more than 2.6 billion impressions and sold out within hours, complementing other activations including T&T and Nantucket that targeted new and younger audiences. LE is also developing sleep as a year-round category, with early indicators described as positive, while initial reads on outerwear and Christmas stockings provide early visibility into 3Q and 4Q. The broader opportunity is to use high-recognition franchises as acquisition products and then convert those customers into repeat and cross-category purchasing, improving lifetime value beyond the initial transaction.
- Core U.S. eCommerce fulfilment has normalized, setting up 3Q as a cleaner read on underlying demand after 2Q benefited from shipment catch-up. S. eCommerce revenue reached $182.4 million, up $15.1 million y/y, but first-half revenue of $335.7 million remained 0.7% below the $338.0 million generated in the comparable prior-year period after the shipment catch-up was completed. Operations are now running at normal throughput, at the same or higher levels than before the WMS disruption, and no incremental impact on 3Q or 4Q guidance is anticipated outside the remaining Outfitters catch-up. Additional supporting warehouse software is expected next year, with the primary opportunity centred on service levels and customer lifetime value rather than a quantified direct earnings contribution. This distinction is important: the WMS should no longer obscure underlying U.S. demand, making 3Q a cleaner test of whether product, acquisition and merchandising initiatives can drive a return to sustainable organic growth in the core eCommerce business.
- Outfitters remained operationally constrained in 2Q despite strong enterprise-account momentum. Outfitters revenue increased 4.4% y/y to $69.3 million in 2Q as enterprise growth more than offset continued delays in school-uniform value-added services, although 1H26 revenue remained 1.4% lower at $107.8 million versus $109.3 million. Enterprise revenue increased more than 15% year-to-date, led by airline accounts, while Delta is currently wear-testing its new uniform collection with more than 1,400 frontline employees ahead of a planned 2H27 rollout. School-uniform backlog remained elevated during 2Q because embroidery, personalization and other value-added orders were more difficult to process under the new WMS, delaying revenue recognition despite solid underlying demand. Throughput has since returned to normal levels, positioning Outfitters to work through the remaining backlog and allowing reported performance to more closely reflect the underlying enterprise and school demand profile.

- Europe and Third Party continue to shift toward higher-quality revenue, prioritizing product margin and brand positioning over promotional volume. Europe eCommerce revenue was broadly stable at $19.7 million in 2Q, but increased 7.5% to $40.3 million in 1H26 as the business moved toward a simplified franchise-first assortment and reduced promotional dependence. Customer acquisition in Europe also improved at a lower cost, while Amazon Germany went live in August and provides an incremental channel to reach new customers. Third Party revenue declined 20.4% to $17.2 million, and first-half revenue declined 14.3% to $30.5 million, reflecting a deliberate pullback from lower-value promotional sales; importantly, like-for-like gross margin improved by more than 500 bps y/y. Nordstrom was a bright spot, with outerwear and Wanderweight performing well during its anniversary sale. We do not view the Third-Party revenue decline as evidence of deterioration in the core business, because the strategy is explicitly sacrificing lower-margin volume to improve channel economics and protect brand integrity.
- The WHP JV is now contributing visible earnings and cash, although retained operations are absorbing the royalty burden before new licensing agreements fully mature. The JV generated $20.1 million of revenue and $8.5 million of net earnings in 2Q, with LE recognizing $4.2 million of equity-method income from its 50% interest. LE recognized $4.4 million of JV income during 1H26 and received $2.4 million of cash distributions, while retained operations incurred $15.4 million of royalty expense in 2Q and $18.9 million year-to-date. The license carries a $50 million annual guaranteed minimum royalty through contract year 11, making growth in third-party JV licensing income increasingly important to the longer-term post-JV earnings equation. The JV has amended several agreements expected to generate more than $150 million of long-term guaranteed royalty value, but newly originated licenses require product development, distribution and retail placement before contributing materially, leaving near-term FY26 economics weighted toward existing licenses and several smaller agreements already in place. The central post-JV thesis therefore remains unchanged: the royalty burden is immediate, while the value creation comes from LE retaining 50% of a growing, capital-light licensing profit pool as WHP expands the brand across new categories and geographies without requiring LE to fund the associated inventory or operating infrastructure.
- AI and personalization are emerging as important elements of LE’s digital strategy, with potential to improve conversion, retention and merchandising efficiency across channels. LE’s approximately 20-year average customer relationship and decades of catalogue and eCommerce engagement provide a substantial first-party data foundation, which the company plans to combine with purchase history, browsing behaviour, geography, weather, inventory availability and category affinity to create more individualized experiences across eCommerce, CRM, catalogue segmentation and marketing. The same approach can extend to Europe and Outfitters, including more targeted outreach around school-uniform purchasing cycles. The objective is to improve conversion, lifetime value and Net Promoter Score by making customer engagement more relevant and timely. LE also appointed Jimmy Ferolo as Chief Digital and Technology Officer, strengthening leadership around digital transformation while maintaining continuity within the existing technology organization.
- Customer-acquisition investment is beginning to produce measurable engagement gains without a material increase in marketing intensity, an encouraging signal for the new digital agenda. U.S. Digital marketing expense increased to $46.0 million from $43.3 million but represented 17.1% of segment revenue compared with 17.0% a year ago, meaning the company generated double-digit new-to-file growth and more than 30% social-traffic growth while marketing intensity remained broadly stable. SG&A increased $5.9 million to $135.3 million, or 44.8% of revenue versus 44.0% a year ago, reflecting higher digital-marketing investment and residual WMS inefficiencies. The next checkpoint is whether stronger engagement translates into higher repeat purchasing, better conversion and more productive full-price demand.
- Gross margin expanded sharply, while channel discipline improved underlying economics despite continued post-JV and WMS costs. Gross profit increased 9.5% to $157.0 million from $143.4 million, while gross margin expanded approximately 320 bps to 52.0% from 48.8%, primarily reflecting the $24.9 million IEEPA tariff recovery, partially offset by $5.1 million of unmitigated tariff costs, the new JV royalty structure and temporary WMS inefficiencies. U.S. Digital variable profit increased $14.7 million to $71.4 million, with margin expanding 440 bps to 26.6% from 22.2%, although the same tariff refund was a principal driver and was partly offset by higher marketing, WMS costs and royalties. Adjusted EBITDA, which removes the tariff recovery and other significant items, declined to $11.3 million from $15.1 million, indicating that underlying profitability remains below prior-year levels despite improved revenue and channel mix.
- Lower financial leverage is already improving earnings conversion under the post-WHP structure despite softer operating EBITDA. Interest expense declined ~89% to $1.0 million from $9.3 million y/y after LE used $234 million of the $300 million WHP transaction proceeds to repay its term loan. Operating income increased to $8.2 million from $4.0 million, while net income improved to $3.5 million, or $0.11 per diluted share, from a ($3.7) million loss, or ($0.12) per share. Adjusted net income similarly improved to $2.7 million from a $1.1 million loss despite the $3.8 million y/y decline in adjusted EBITDA. The earnings bridge demonstrates the benefit of the post-JV capital structure, with lower interest expense already improving equity earnings while further EBITDA recovery would provide the next leg of earnings growth.
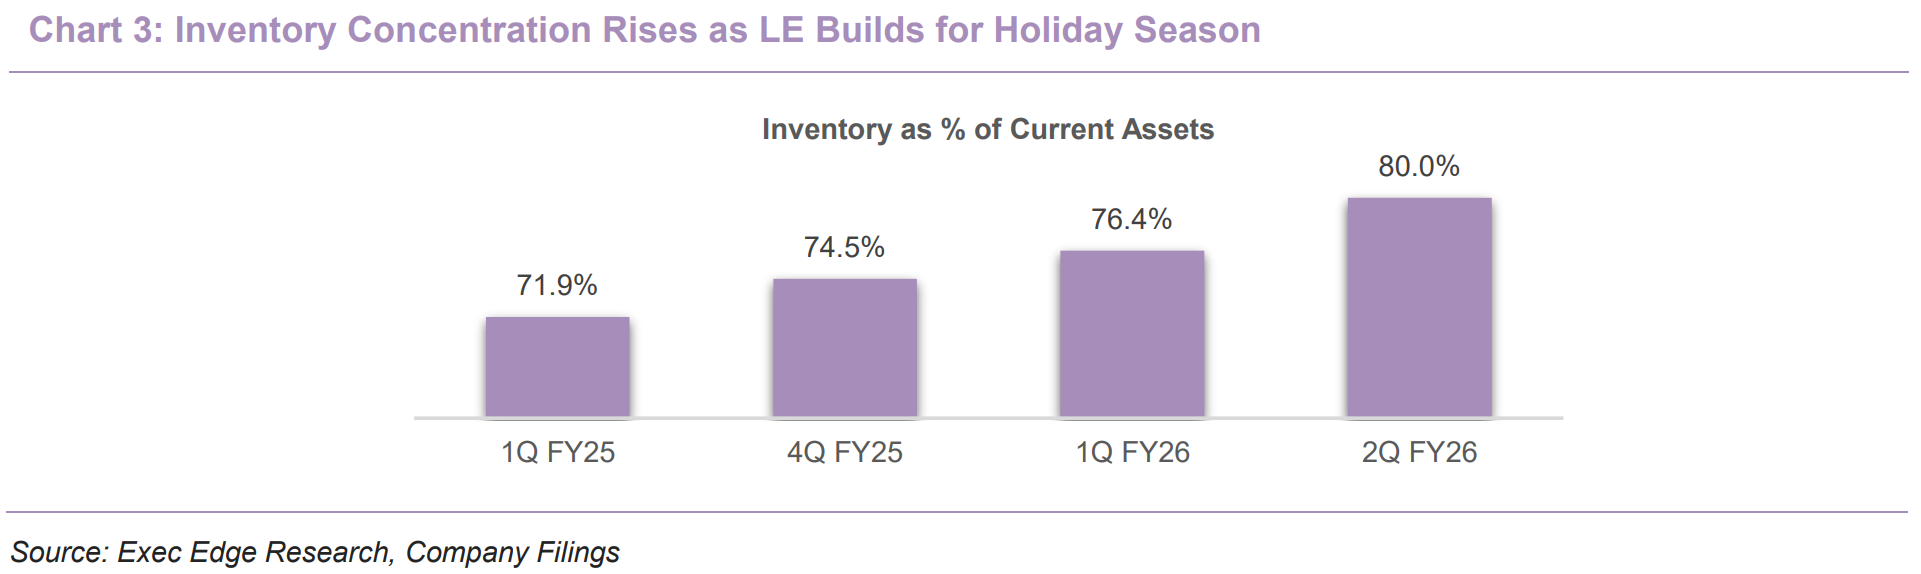
- Inventory remains elevated heading into the holiday season, making sell-through and working-capital conversion critical alongside the broader operating recovery. Inventory reached $342.0 million at quarter-end, up 13% from $301.8 million a year ago and 27% from $268.8 million at FY25-end, reflecting a more normal seasonal build after last year’s deliberately lean tariff-driven position, continued tariff headwinds and residual value-added-service processing delays. The inventory build used $73.9 million of cash during the first half, contributing to operating cash flow of negative $86.5 million versus positive $0.5 million a year ago. The broader outerwear assortment creates a larger back-half revenue opportunity after last year’s conservative buys, but the quality of the inventory build will ultimately be measured by full-price sell-through and cash conversion rather than merchandise availability alone.
- Capital allocation became more active despite the seasonal working-capital build, reflecting the increased flexibility created by eliminating the term loan. LE ended 2Q with $16.1 million of cash, $60.0 million of ABL borrowings and $89.3 million of remaining ABL availability. The increase in revolver usage coincides with the seasonal inventory build and approximately $24.0 million of first-half capital expenditure, while the company continues to expect roughly $40 million of FY26 capex. LE repurchased approximately 910,000 shares for $10.5 million during 2Q, representing roughly 3% of outstanding shares, leaving $89.2 million under the $100 million authorization through March 2029. We view the repurchases as supportive at the current valuation, although the pace of future capital returns should remain balanced against working-capital needs, technology investment and sustainable free cash generation.
- 3Q should provide a cleaner read on underlying demand and margin recovery as fulfilment normalizes and temporary operating inefficiencies ease. Management guided 3Q revenue to $300-$330 million and adjusted EBITDA to $14-$18 million, while Street estimates sourced from TIKR sit at $319.3 million and $15.9 million, respectively. Importantly, the WMS is no longer expected to create an incremental headwind outside the remaining Outfitters catch-up, making the quarter a better test of whether recent customer-acquisition gains, franchise momentum and improved service levels are translating into underlying growth. The Street estimate implies a 5.0% EBITDA margin in 3Q versus 3.7% in 2Q, suggesting further margin normalization as temporary operating inefficiencies ease. With tariffs at currently implemented rates already reflected in guidance, execution around demand conversion, Outfitters backlog clearance and product margin should increasingly determine the near-term earnings trajectory.
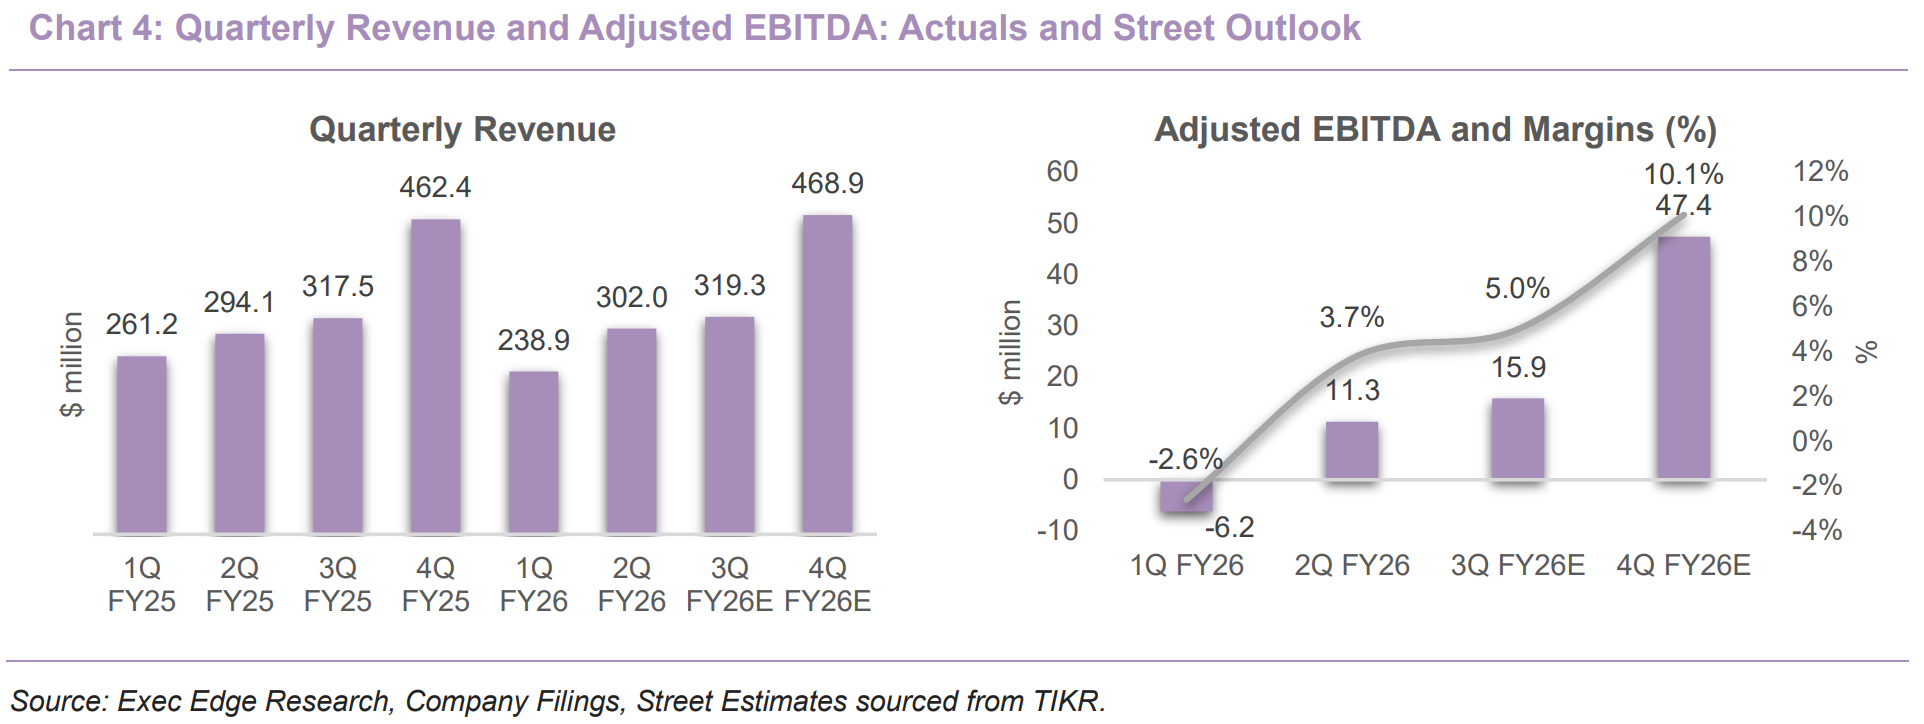
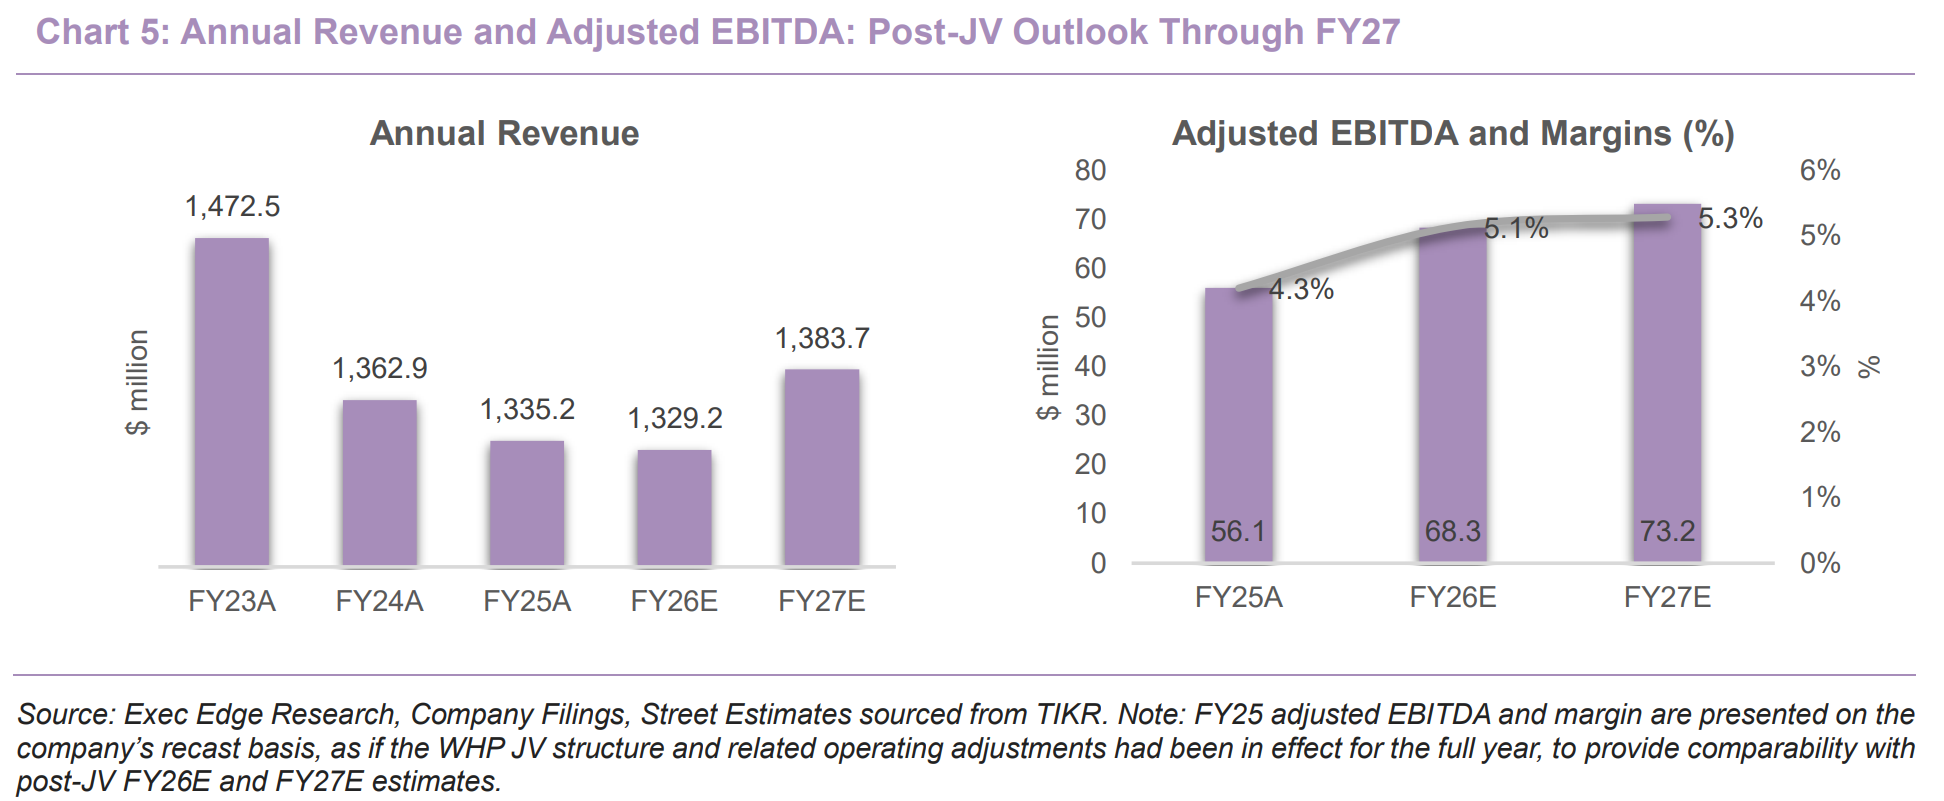
- FY26 outlook continues to support post-JV earnings growth, while lower financial leverage is improving earnings conversion. Management guides FY26 revenue to $1.30-$1.35 billion, adjusted EBITDA to $62-$70 million and adjusted EPS to $0.44-$0.72. Street estimates sourced from TIKR indicate $1.33 billion in revenue, $68.3 million of EBITDA and $0.51 of normalized EPS, consistent with broadly stable revenue and progressive margin rebuilding under the post-JV structure. Importantly, the $68.3 million FY26 EBITDA estimate represents 21.8% growth from the comparable $56.1 million recast FY25 post-JV base, providing a more relevant measure of underlying earnings progression than reported FY25 results. Looking into FY27, Street estimates call for revenue growth of 4.1% to $1.39 billion and EBITDA growth of 7.1% to $73.2 million, supporting continued organic growth, better operating leverage and increasing benefits from the capital-light JV model.
Valuation: Discount Persists Despite Stronger Post-JV Growth Profile
- Disclaimer: Exec Edge does not publish proprietary estimates, ratings, price targets, or investment recommendations. The valuation discussion below is illustrative only and is based on company filings, management commentary, and third-party data and estimates. It does not constitute a recommendation, price target, rating, or prediction of future pricing.
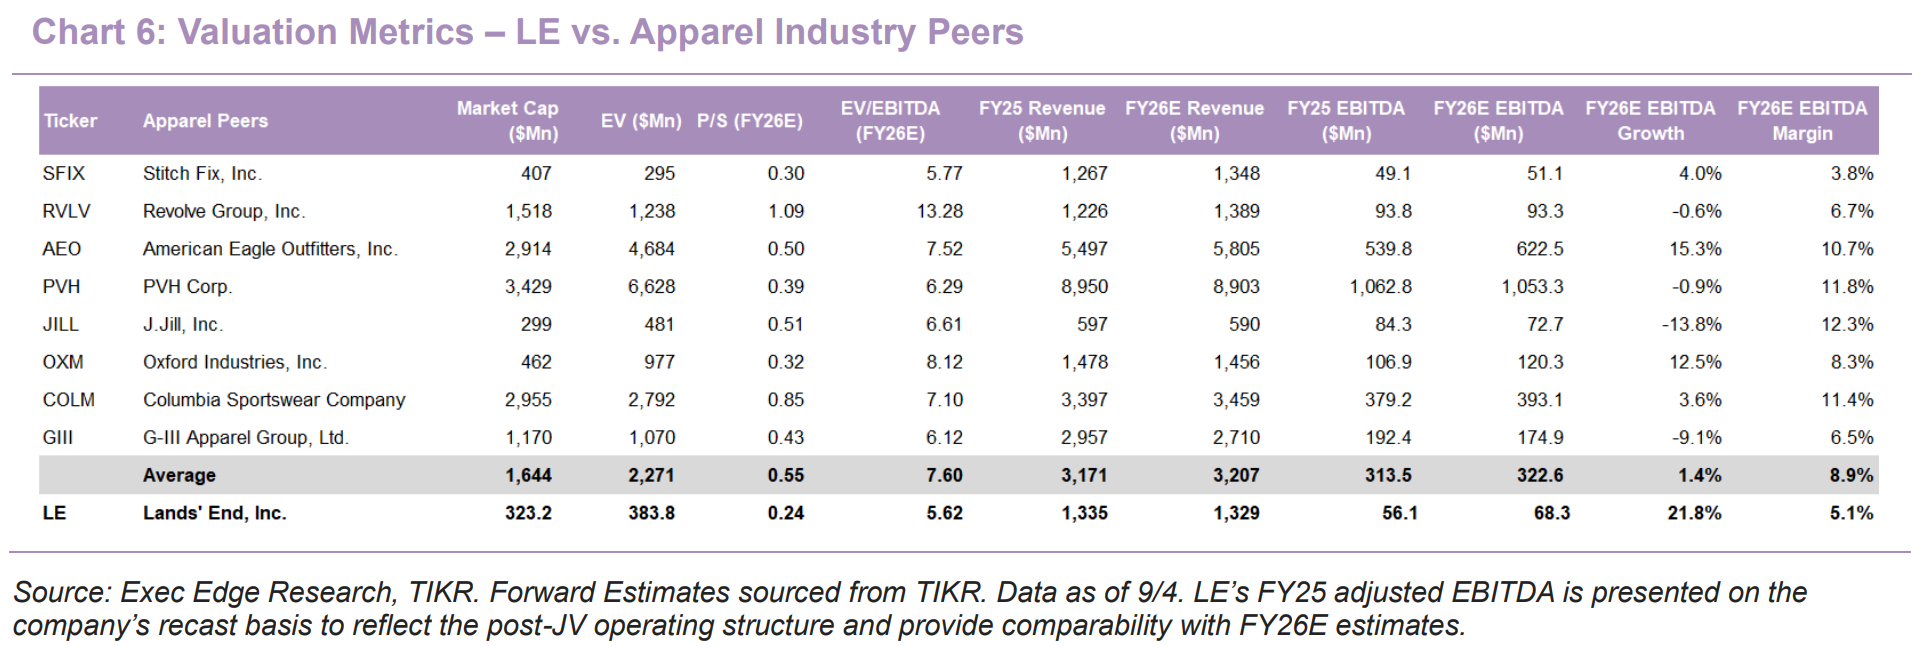
- LE continues to trade at a meaningful discount to apparel peers despite an improving post-JV earnings profile and above-peer expected EBITDA growth. LE currently trades at a market capitalization of ~$323 million and enterprise value of ~$384 million. This translates to 5.62x FY26E EV/EBITDA and 0.24x FY26E P/S, compared with peer averages of 7.60x and 0.55x, respectively, representing discounts of approximately 26% and 56%. Street estimates sourced from TIKR call for FY26E EBITDA growth of 21.8% from the comparable $56.1 million recast FY25 base versus 1.4% average growth for peers. LE’s 5.1% FY26E EBITDA margin remains below the peer average of 8.9%, leaving meaningful earnings upside if the post-JV model closes part of the profitability gap.
- Applying the peer-based valuation framework continues to indicate meaningful illustrative upside.
- Applying the 7.60x peer average to FY26E EBITDA of $68.3 million implies enterprise value of $519 million and, after adjusting for ~$61 million of lease-adjusted net debt, illustrative equity value of roughly $458 million, or approximately $15.5 per share.
- Applying the 0.55x peer P/S multiple to Street FY26E revenue of $1.329 billion implies illustrative equity value of approximately $730 million, or roughly $24.7 per share.
- Importantly, these values are illustrative and not a price target. They value LE as an integrated post-JV business, including its retained 50% JV interest, while assigning no separate value to potential WHP monetization or exchange optionality.
- We believe the current discount can narrow as the benefits of the post-JV structure become more visible in earnings and cash flow. Fulfilment normalization, improving customer acquisition, Outfitters backlog conversion and service normalization, margin expansion, increasing JV income and distributions, and better working-capital conversion represent the principal rerating drivers. Cole’s focus on digital execution, personalization and customer lifetime value provides an additional medium-term lever, while the substantially reduced debt burden improves earnings conversion and strategic flexibility. With LE trading below peer multiples despite stronger expected EBITDA growth, continued execution should support scope for multiple expansion as the business demonstrates a more profitable, less leveraged and increasingly capital-light earnings profile.
Read Exec Edge’s Initiation on Lands’ End Here
Subscribe to our Weekly Newsletter to Receive All Research
Contact:







[…] Lands’ End New CEO Agenda, Customer Growth – Quarterly Update Report […]
[…] Lands’ End New CEO Agenda, Customer Growth – Quarterly Update Report […]